Skip to content


Last updated: November 2026. Human written and fact checked. Figures calculated by Expert Windows from SEAI’s published BER data.
Ireland’s Building Energy Rating records describe the windows and doors of more than 1.4 million homes, but the figures are rarely published as statistics. Expert Windows analysed all 1,419,141 published BER ratings in SEAI’s public dataset to measure how well Irish windows and doors perform: how many homes still have windows at single-glazing level, how windows vary by the age, type and location of a home, how much heat they let out, and how much they have improved since 2009. Every figure on this page was calculated by Expert Windows from SEAI data, with the method set out below.
Key Windows and Doors Statistics for Ireland at a Glance
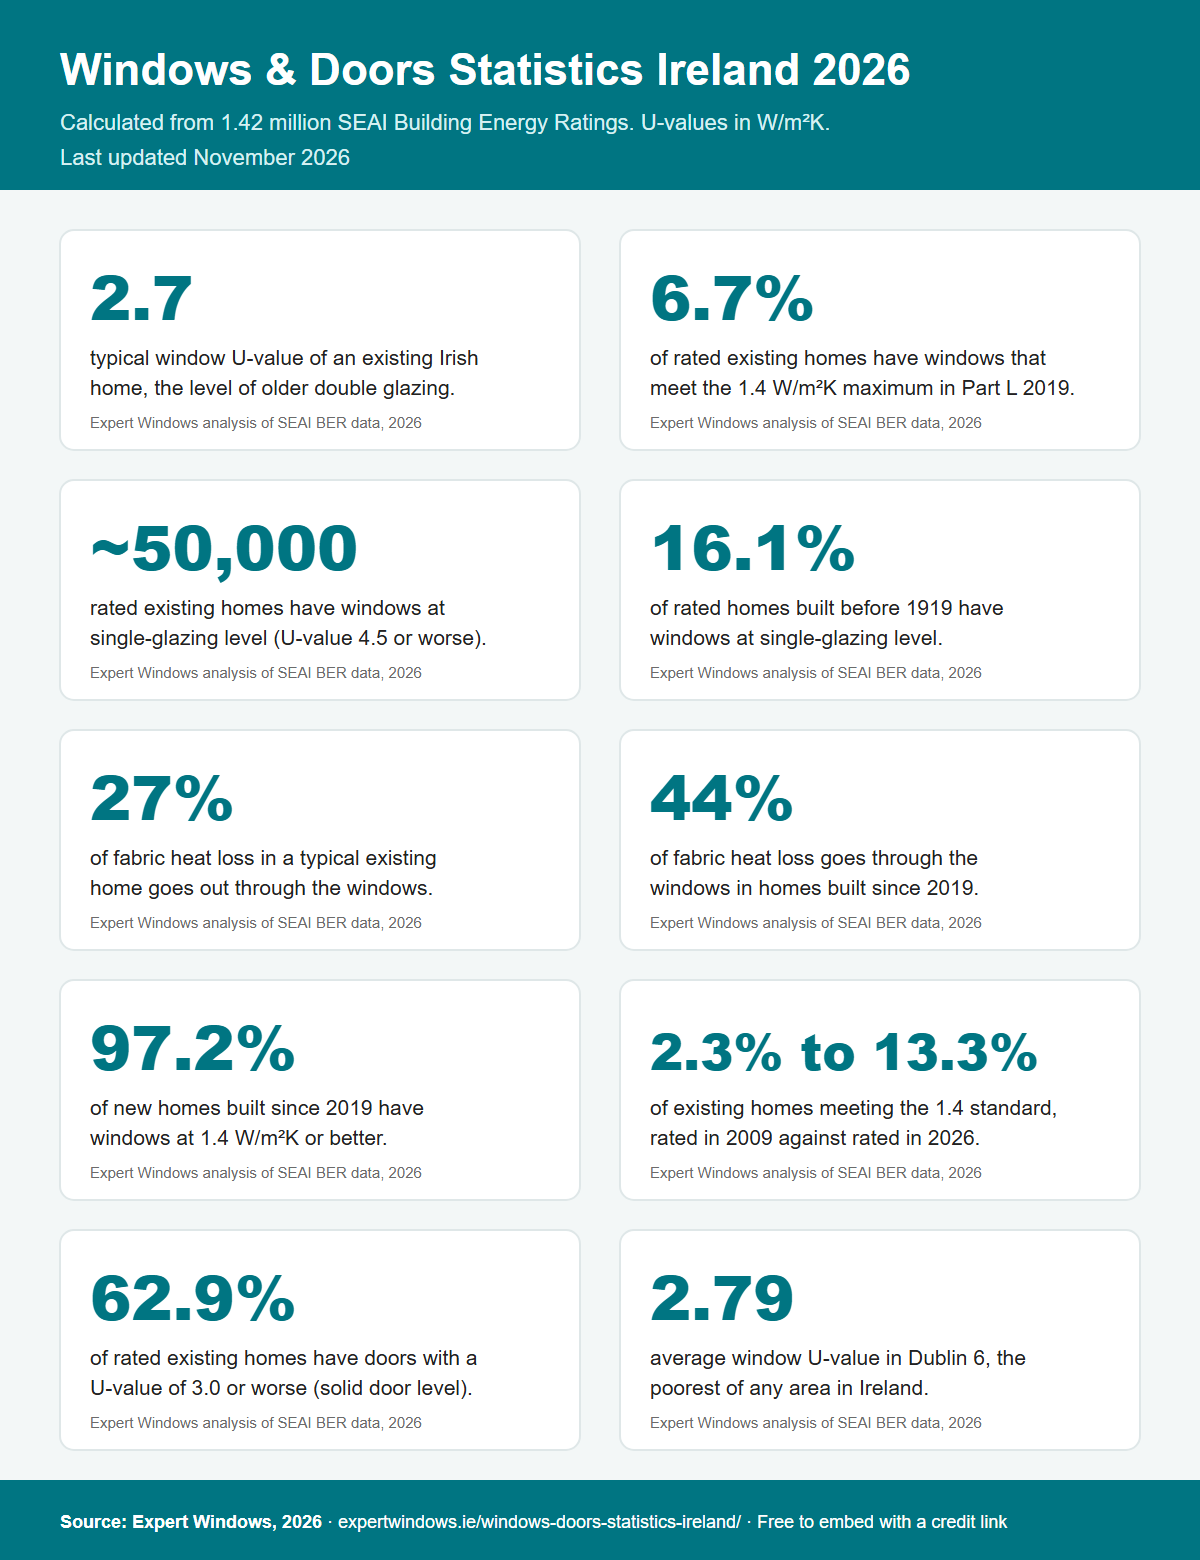
- The typical existing Irish home has an average window U-value of 2.7 W/m²K, the level of older air-filled double glazing. Source: calculated by Expert Windows from the SEAI BER Research Tool
- Only 6.7% of rated existing homes have windows that meet the 1.4 W/m²K maximum for windows in the 2019 Building Regulations (Part L). Source: calculated from SEAI BER data
- 4.2% of rated existing homes, about 50,000, have an average window U-value of 4.5 or worse, consistent with mostly single-glazed windows. Source: calculated from SEAI BER data
- In homes built before 1919, 16.1% of ratings show windows at single-glazing level. Source: calculated from SEAI BER data
- Windows account for 27% of the heat lost through the walls, roof, floor, windows and doors of a typical existing home, and 44% in homes built since 2019. Source: calculated from SEAI BER data
- 97.2% of new homes built since 2019 have windows at 1.4 W/m²K or better, with a typical U-value of 1.2. Source: calculated from SEAI BER data
- Among existing homes rated in 2009, 2.3% met the 1.4 standard. Among those rated in 2026, 13.3% did. Source: calculated from SEAI BER data
- The average rated home has 20.7 m² of windows, about 28% of its floor area for a typical home. Source: calculated from SEAI BER data
- 62.9% of rated existing homes have external doors with an average U-value of 3.0 or worse, the default value for a solid door. Source: calculated from SEAI BER data
- Dublin 6 and Cork City have the poorest-performing windows of any area, with average U-values of 2.79 and 2.79. Source: calculated from SEAI BER data
The Data Behind These Figures
Every home sold or let in Ireland needs a Building Energy Rating, and SEAI publishes an anonymised record of every rating through its SEAI BER Research Tool. Each record includes the average U-value and total area of the home’s windows and doors, measured for the whole opening including the frame, along with the year the home was built, its county or Dublin postal district and its dwelling type.
Expert Windows downloaded the full dataset as published on 3 November 2026. It contains 1,461,215 ratings. We excluded 42,074 provisional ratings for homes not yet built, leaving 1,419,141: 1,191,112 ratings of existing homes and 228,029 final ratings of new homes. That is close to the 1,407,196 rated homes the CSO counted at the end of September 2026 in its CSO Domestic Building Energy Ratings Q3 2026 release.
A U-value measures how much heat passes through a window: the lower the number, the better it keeps heat in. A home’s figure is the average across all its windows, so a house with a mix of old and new windows sits somewhere in between.
How Well Irish Windows Perform
To put the U-values in context, SEAI’s SEAI DEAP guide, Table 2.28 lists the default values BER assessors use when no certified figure is available. A single-glazed window in a wood or PVC frame is rated at 4.8 W/m²K, or 5.7 in a metal frame. Air-filled double glazing in a wood or PVC frame ranges from 2.7 to 3.1, depending on the gap between the panes, and secondary glazing is 2.4. The 2019 Building Regulations set a maximum of 1.4 W/m²K for windows, according to SEAI’s BER Research Tool user guide.
| Average window U-value (W/m²K) | Existing homes | New homes |
|---|---|---|
| 1.0 or better | 2.1% | 14.4% |
| 1.4 or better (meets the 2019 maximum) | 6.7% | 88.0% |
| 2.0 or better | 17.3% | 97.6% |
| 3.3 or worse | 10.8% | 0.0% |
| 4.5 or worse (single-glazing level) | 4.2% | 0.0% |
| Typical (median) U-value | 2.70 | 1.21 |
Source: calculated by Expert Windows from 1,190,980 existing-home and 228,006 new-home ratings in the SEAI BER Research Tool dataset (published 3 November 2026). Rows are cumulative shares, not separate bands.
The typical existing home has windows rated at 2.7 W/m²K, almost twice the 1.4 maximum in the 2019 Building Regulations, and 93.3% of rated existing homes fall short of it. At the other end, 4.2% of existing homes, about 50,000 ratings, average 4.5 or worse, a level that only single glazing reaches in SEAI’s default values.
Windows by Age of Home
Window performance tracks the age of the home closely, although many older homes have had their windows replaced since they were built.
| Year built | Ratings | Average window U-value | Meets 1.4 standard | Single-glazing level (4.5+) |
|---|---|---|---|---|
| Before 1919 | 98,173 | 3.09 | 5.9% | 16.1% |
| 1919 to 1945 | 78,534 | 2.87 | 7.4% | 10.9% |
| 1946 to 1960 | 82,812 | 2.80 | 8.1% | 9.0% |
| 1961 to 1970 | 67,770 | 2.74 | 7.6% | 5.7% |
| 1971 to 1980 | 141,180 | 2.71 | 7.2% | 4.5% |
| 1981 to 1990 | 119,941 | 2.71 | 7.2% | 4.8% |
| 1991 to 2000 | 205,509 | 2.69 | 6.3% | 0.7% |
| 2001 to 2005 | 238,263 | 2.51 | 3.9% | 0.1% |
| 2006 to 2010 | 150,287 | 2.15 | 4.9% | 0.0% |
| 2011 to 2015 | 17,051 | 1.57 | 40.7% | 0.0% |
| 2016 to 2020 | 76,061 | 1.26 | 81.2% | 0.0% |
| 2021 or later | 143,560 | 1.19 | 97.7% | 0.0% |
Source: calculated by Expert Windows from SEAI BER Research Tool data, existing and new ratings combined. Year built is approximate for older homes.
Homes built before 1919 have the poorest windows, with an average U-value of 3.09 and 16.1% of ratings at single-glazing level, about 15,800 ratings. The share at single-glazing level falls steadily with each decade and is close to zero for homes built after 2000. The big step change comes after 2010: 40.7% of homes built between 2011 and 2015 meet the 1.4 standard, rising to 81.2% for 2016 to 2020 and 97.7% for homes built since 2021.
The homes built in the 1990s and early 2000s are a large middle group. Ratings of homes built between 1991 and 2005 number 443,772, and only 6.3% and 3.9% of them meet the 1.4 standard. Where those homes still have their original double glazing, it is now 20 to 35 years old. The age profile of Irish homes is on our Irish housing stock statistics page.
Windows Across the Country
Where homes are older, windows are poorer. Cork City, Tipperary, Leitrim and Limerick City have the highest average window U-values outside Dublin, while Kildare, Meath and the parts of County Dublin outside the postal districts, where much of the housing is newer, have the lowest.
| County or city | Ratings | Average window U-value | Meets 1.4 standard | Single-glazing level (4.5+) |
|---|---|---|---|---|
| Cork City | 19,289 | 2.79 | 7.6% | 5.7% |
| County Tipperary | 43,281 | 2.59 | 11.9% | 4.2% |
| County Leitrim | 10,496 | 2.59 | 7.1% | 4.7% |
| Limerick City | 26,304 | 2.58 | 13.5% | 2.6% |
| County Clare | 33,690 | 2.55 | 12.2% | 4.0% |
| County Limerick | 31,643 | 2.55 | 14.7% | 4.1% |
| County Roscommon | 17,207 | 2.55 | 10.7% | 5.4% |
| County Mayo | 37,570 | 2.53 | 11.9% | 4.2% |
| County Cavan | 20,011 | 2.51 | 10.2% | 3.4% |
| County Offaly | 19,256 | 2.50 | 15.1% | 3.7% |
| County Westmeath | 25,918 | 2.50 | 14.6% | 3.2% |
| County Kerry | 43,368 | 2.49 | 13.9% | 3.6% |
| Waterford City | 16,532 | 2.49 | 16.5% | 3.1% |
| County Donegal | 42,880 | 2.48 | 12.4% | 3.6% |
| Galway City | 22,732 | 2.48 | 14.3% | 1.2% |
| County Longford | 11,906 | 2.47 | 13.8% | 3.5% |
| County Galway | 51,952 | 2.46 | 15.3% | 3.5% |
| County Sligo | 20,924 | 2.45 | 12.9% | 3.4% |
| County Wexford | 46,686 | 2.42 | 17.1% | 3.3% |
| County Carlow | 17,583 | 2.42 | 15.4% | 3.0% |
| County Waterford | 20,787 | 2.41 | 19.1% | 3.3% |
| County Cork | 140,429 | 2.40 | 20.1% | 3.2% |
| County Kilkenny | 23,225 | 2.40 | 18.3% | 3.5% |
| County Louth | 41,314 | 2.37 | 23.1% | 3.7% |
| County Monaghan | 13,687 | 2.37 | 18.1% | 3.7% |
| County Laois | 22,441 | 2.35 | 21.2% | 3.1% |
| County Wicklow | 44,148 | 2.29 | 25.7% | 3.3% |
| County Meath | 56,362 | 2.24 | 27.6% | 2.1% |
| County Dublin | 110,335 | 2.20 | 29.9% | 2.1% |
| County Kildare | 67,142 | 2.20 | 30.1% | 2.1% |
Source: calculated by Expert Windows from SEAI BER Research Tool data, existing and new ratings combined. SEAI records Dublin by postal district; “County Dublin” covers rated homes outside the numbered districts. Ranked from poorest to best average U-value.
Within Dublin the spread is wider still. Dublin 6 (2.79), Dublin 7 (2.74) and Dublin 5 (2.65) have the poorest average window U-values of any postal district, and 10.0% of rated homes in Dublin 6 have windows at single-glazing level. Dublin 18 has the best, at 1.86, with 46.2% of rated homes meeting the 1.4 standard. Energy ratings for every Dublin district are on our Dublin home statistics page.
Windows by Type of Home
| Type of home | Ratings | Average window U-value | Meets 1.4 standard | Average window area (m²) |
|---|---|---|---|---|
| Detached house | 440,688 | 2.50 | 13.2% | 30.5 |
| Semi-detached house | 373,318 | 2.37 | 20.8% | 19.7 |
| End of terrace house | 106,814 | 2.34 | 26.4% | 16.1 |
| Mid-terrace house | 191,941 | 2.52 | 19.2% | 14.3 |
| Ground-floor apartment | 75,281 | 2.32 | 23.9% | 10.9 |
| Mid-floor apartment | 109,334 | 2.11 | 36.0% | 13.1 |
| Top-floor apartment | 77,317 | 2.39 | 20.5% | 12.3 |
| Maisonette | 17,757 | 2.21 | 30.9% | 14.7 |
Source: calculated by Expert Windows from SEAI BER Research Tool data, existing and new ratings combined. Dwelling types as recorded by BER assessors.
Detached houses have the most glass, an average of 30.5 m² of windows, and mid-terrace houses some of the poorest windows, with 5.4% at single-glazing level. Mid-floor apartments have the best average windows, partly because so many apartments are recent, and 36.0% of them meet the 1.4 standard.
How Much Heat Goes Through the Windows
A BER record lists the U-value and area of each part of a home’s outer fabric, which makes it possible to work out how the heat lost through the fabric is split between walls, roof, floor, windows and doors. Expert Windows calculated each element’s share for every rating by multiplying its U-value by its area.
In the typical existing home, windows account for 27% of that fabric heat loss. The share rises as the rest of the house gets better insulated. In homes built before 1919 windows account for 16%, because solid walls lose so much heat, but in homes built since 2021 they account for 44%. In a new home with well-insulated walls and roof, the windows are often the weakest part of the outer fabric, even when they meet today’s standard.
This share covers heat lost through the fabric only, not heat lost through ventilation and draughts. How heat loss affects bills is covered on our household energy bills statistics page, and the national picture on energy ratings is on our home energy efficiency statistics page.
How Windows Have Improved Since 2009
Windows in existing homes have improved steadily over the years that ratings have been published, calculated by Expert Windows from the date each existing home was assessed.
| Year existing home was rated | Ratings | Average window U-value | Meets 1.4 standard | Single-glazing level (4.5+) |
|---|---|---|---|---|
| 2009 | 31,678 | 2.85 | 2.3% | 8.3% |
| 2012 | 38,634 | 2.91 | 1.4% | 8.0% |
| 2015 | 57,708 | 2.84 | 1.2% | 5.6% |
| 2018 | 53,259 | 2.77 | 2.8% | 4.6% |
| 2020 | 47,578 | 2.62 | 5.8% | 3.2% |
| 2022 | 74,884 | 2.50 | 9.7% | 2.7% |
| 2024 | 105,146 | 2.43 | 12.0% | 2.4% |
| 2025 | 119,711 | 2.42 | 12.2% | 2.5% |
| 2026 (to 3 November) | 139,393 | 2.39 | 13.3% | 2.2% |
Source: calculated by Expert Windows from existing-home ratings in the SEAI BER Research Tool dataset, by year of assessment. Selected years shown.
The share of existing homes with windows meeting the 1.4 standard rose from 2.3% among homes rated in 2009 to 13.3% among those rated in 2026, while the share at single-glazing level fell from 8.3% to 2.2%. Part of this reflects real upgrades, and part reflects which homes are being rated: about 29% of all published ratings were carried out for grant applications, which are often done after upgrade works.
External Doors
Doors have changed less than windows. 62.9% of rated existing homes have external doors with an average U-value of 3.0 W/m²K or worse, the default value for a solid door in SEAI’s SEAI DEAP guide, Table 2.28, and the typical existing home sits at exactly 3.0. Only 13.8% of existing homes have doors averaging 1.4 or better.
New homes are very different: 77.1% of new homes have doors at 1.4 or better, with a typical value of 1.40. The share of existing homes with doors at 3.0 or worse has fallen from 78.5% among homes rated in 2009 to 56.1% among those rated in 2026. For the security side of front doors, see our burglary statistics for Ireland.
Using and Citing These Figures
Three points help when quoting these statistics. First, they describe rated homes, not every home: a BER is needed when a home is sold or let, and ratings are also done for grant applications, so homes that have never been sold, let or upgraded are under-represented. Second, a home’s U-value is the average of all its windows or doors, so the single-glazing figures describe homes whose windows perform at that level on average, not an exact count of single-glazed windows. Third, a home that has been rated more than once can appear more than once in the dataset.
Journalists, researchers and industry bodies are welcome to use the figures and the infographic on this page. Please credit Expert Windows with a link to this page and name SEAI’s BER Research Tool as the underlying data source.
Method and Sources
Expert Windows downloaded the full SEAI BER Research Tool dataset (BERPublicSearch, published 3 November 2026, 1,461,215 ratings) and analysed it in November 2026. Provisional ratings (42,074) were excluded. Window U-values outside 0.5 to 7.0 W/m²K (155 records) and window areas of zero or over 200 m² (536 records) were excluded from the relevant figures. Shares at or below 1.0, 1.4 and 2.0, and at or above 3.3 and 4.5 W/m²K, were counted from each rating’s average window U-value. Fabric heat loss shares were calculated for each rating as window U-value times window area divided by the sum of U-value times area for walls, roof, ground floor, windows and doors, then averaged. Medians were taken from values rounded to 0.01. Reference values come from SEAI’s DEAP guide (Table 2.28, version 4.3.1) and the 2019 Building Regulations maximum as stated in SEAI’s BER Research Tool user guide, and the national total from the CSO’s Domestic Building Energy Ratings Q3 2026. SEAI provides the data and takes no responsibility for its analysis or interpretation; all calculations are Expert Windows’ own. The page will be updated as SEAI publishes new ratings.
How Expert Windows Helps
If your home’s windows are among the many still at older double-glazing or single-glazing level, Expert Windows supplies and fits replacement double glazed and triple glazed windows, as well as uPVC windows and entrance doors, across Dublin and the surrounding counties. Our window replacement team can survey your home and provide a quotation.