Skip to content


Last updated: October 2026. Human written and fact checked against each named source.
County Dublin had 565,321 homes at the 2022 census, more than a quarter of the housing stock in Ireland, and it is building more new homes than any other region. This page gathers the current statistics on Dublin’s homes in one place: how many there are, what types and ages they are, who owns and rents them, how energy ratings vary across the 22 Dublin postal districts, how many new homes are being completed, and how vacancy, burglary and fires compare, using Dublin-level data with every figure linked to its primary source.
Key Dublin Home Statistics at a Glance
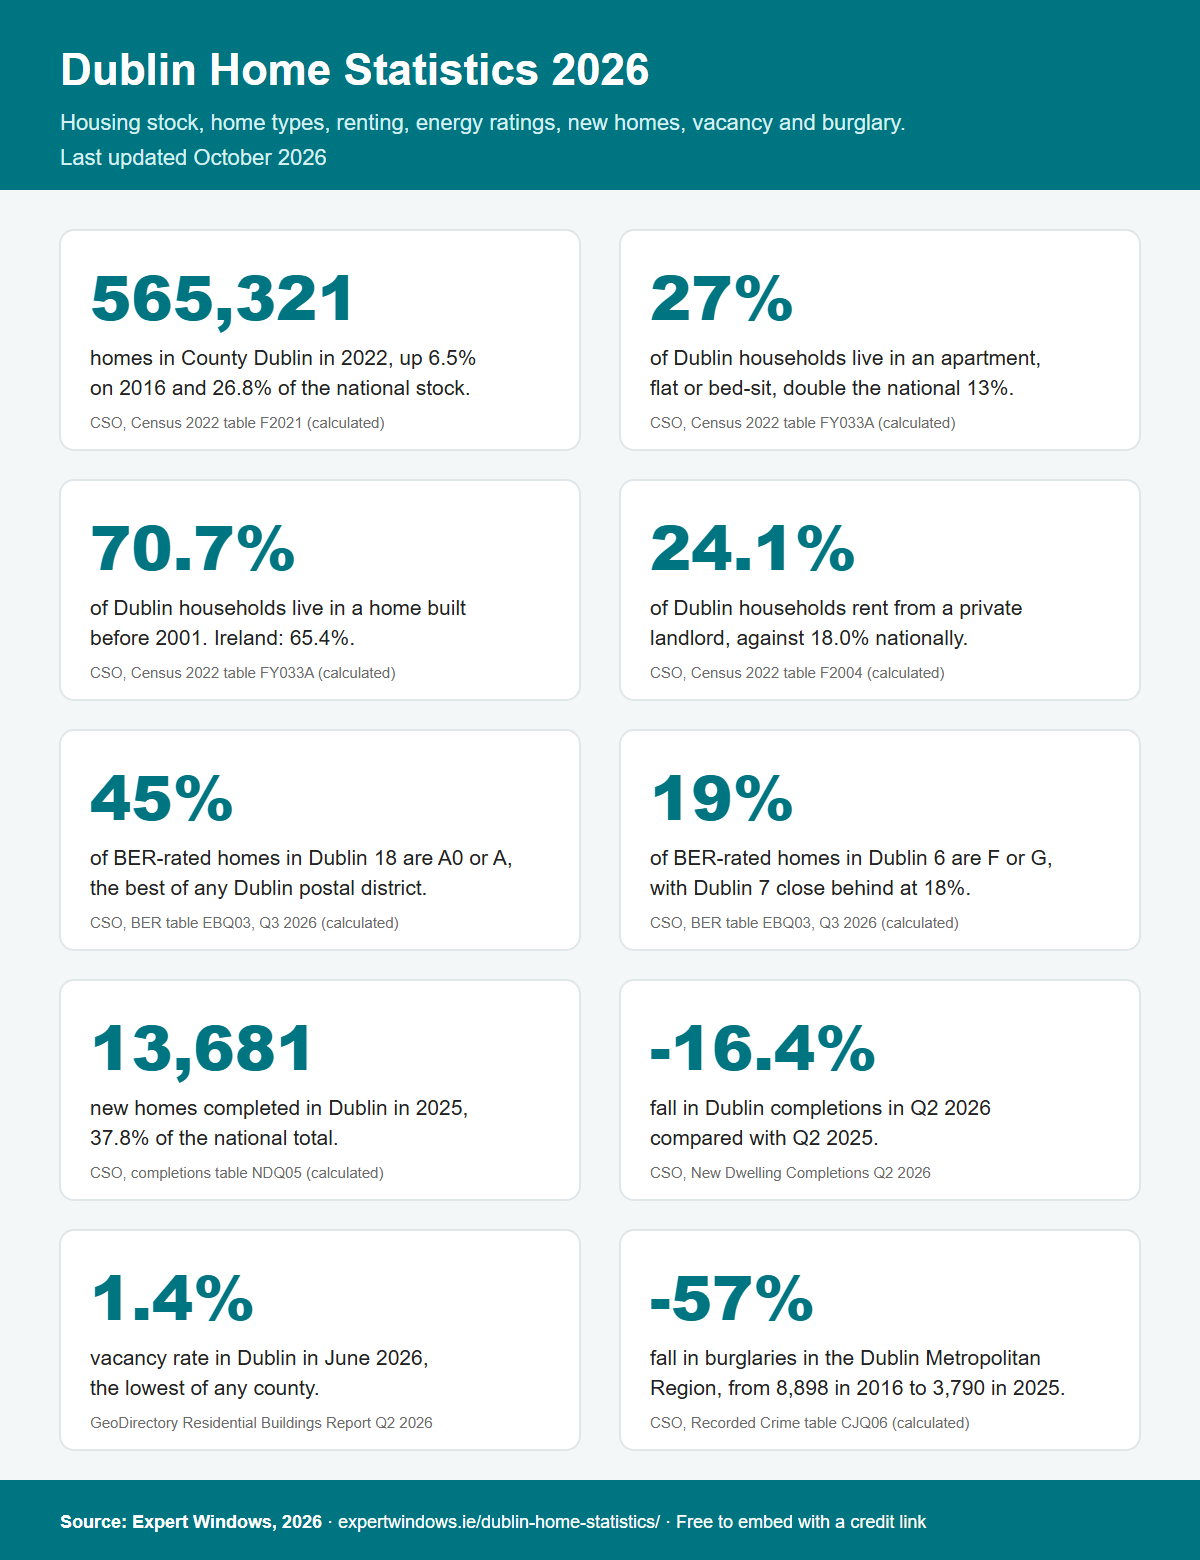
- County Dublin had 565,321 homes in 2022, up 6.5% on 2016 and 26.8% of the national housing stock. Source: CSO, Census 2022 table F2021 (change and share calculated)
- 27% of Dublin households live in an apartment, flat or bed-sit, double the national share of 13%. Source: CSO, Census 2022 table FY033A (shares calculated)
- 70.7% of Dublin households live in a home built before 2001, against 65.4% nationally. Source: CSO, Census 2022 table FY033A (shares calculated)
- 24.1% of Dublin households rent from a private landlord, against 18.0% across Ireland. Source: CSO, Census 2022 table F2004 (shares calculated)
- 45% of BER-rated homes in Dublin 18 are rated A0 or A, the highest share of any Dublin postal district. Source: CSO, Domestic Building Energy Ratings Q3 2026, table EBQ03 (shares calculated)
- 19% of BER-rated homes in Dublin 6 and 18% in Dublin 7 are rated F or G, more than twice the national 8.8%. Source: CSO, table EBQ03, Q3 2026 (shares calculated)
- 13,681 new homes were completed in Dublin in 2025, 37.8% of all completions in Ireland. Source: CSO, New Dwelling Completions table NDQ05 (total and share calculated)
- Dublin completions fell 16.4% in the second quarter of 2026 compared with a year earlier. Source: CSO, New Dwelling Completions Q2 2026
- Dublin had the lowest residential vacancy rate in Ireland in June 2026, at 1.4%. Source: GeoDirectory Residential Buildings Report Q2 2026
- Burglaries recorded in the Dublin Metropolitan Region fell 57%, from 8,898 in 2016 to 3,790 in 2025. Source: CSO, Recorded Crime table CJQ06 (totals and change calculated)
How Many Homes Dublin Has
The 2022 census counted 565,321 homes across the four Dublin local authorities, according to the CSO’s housing stock table F2021. That was 6.5% more than the 530,753 counted in 2016, and 26.8% of the national stock, calculated from the same table. Growth between 2011 and 2016 had been almost flat, at 0.6%.
| Local authority | Homes, 2022 | Occupied households, 2022 |
|---|---|---|
| Dublin City | 250,632 | 225,519 |
| Fingal | 115,358 | 107,599 |
| South Dublin | 106,074 | 100,262 |
| Dún Laoghaire-Rathdown | 93,257 | 85,110 |
| County Dublin | 565,321 | 518,490 |
Sources: CSO Census 2022, tables F2021 (housing stock, including vacant homes and holiday homes) and FY033A (private households in permanent housing units). County totals calculated by Expert Windows.
Dublin’s 518,490 occupied households are 28.2% of the 1,836,728 in Ireland, a higher share than its share of the housing stock because fewer Dublin homes stand empty.
What Kinds of Homes Dubliners Live In
Dublin’s housing looks very different from the rest of the country. Terraced houses and apartments are far more common, and detached houses are rare.
| Type of home | Dublin households | Share in Dublin | Share in Ireland |
|---|---|---|---|
| Terraced house | 173,137 | 33.4% | 20.3% |
| Semi-detached house | 154,941 | 29.9% | 25.4% |
| Apartment in a purpose-built block | 115,371 | 22.3% | 10.4% |
| Detached house | 50,137 | 9.7% | 41.2% |
| Flat in a converted house or building | 23,685 | 4.6% | 2.7% |
| Bed-sit | 1,219 | 0.2% | 0.1% |
Source: CSO Census 2022, table FY033A. Shares calculated by Expert Windows; households that did not state their type are not shown.
Apartments, flats and bed-sits together house 27.0% of Dublin households, calculated from the same table. The share is highest in Dublin City Council’s area, at 38.5%, followed by Dún Laoghaire-Rathdown (24.7%), Fingal (17.3%) and South Dublin (13.9%).
How Old Dublin’s Homes Are
Most of Dublin’s homes are decades old. 70.7% of households live in a home built before 2001, compared with 65.4% across Ireland, according to the CSO’s table FY033A.
| Period built | Dublin households | Share in Dublin | Share in Ireland |
|---|---|---|---|
| Before 1919 | 42,120 | 8.1% | 8.4% |
| 1919 to 1945 | 37,030 | 7.1% | 6.2% |
| 1946 to 1960 | 52,537 | 10.1% | 7.2% |
| 1961 to 1970 | 47,187 | 9.1% | 6.7% |
| 1971 to 1980 | 69,625 | 13.4% | 12.2% |
| 1981 to 1990 | 51,140 | 9.9% | 10.1% |
| 1991 to 2000 | 66,882 | 12.9% | 14.5% |
| 2001 to 2010 | 96,591 | 18.6% | 24.5% |
| 2011 to 2015 | 12,054 | 2.3% | 2.7% |
| 2016 or later | 30,290 | 5.8% | 5.1% |
Source: CSO Census 2022, table FY033A. Shares calculated by Expert Windows; 2.5% of Dublin households did not state when their home was built.
Dublin stands out for its mid-century homes. 19.2% of households live in homes built between 1946 and 1970, the era of the city’s large estates, against 13.9% nationally. Over a third (34.5%) live in homes built before 1971. The 2000s building boom left a smaller mark in Dublin than elsewhere, with 18.6% of homes built between 2001 and 2010 against 24.5% nationally.
The age profile varies by area. In Dublin City Council’s area 77.3% of households live in homes built before 2001, compared with 73.5% in Dún Laoghaire-Rathdown, 71.0% in South Dublin and 54.5% in Fingal, where more of the housing is recent. The national picture is covered on our Irish housing stock statistics page.
Owning and Renting in Dublin
Dublin is a city of renters compared with the rest of Ireland. 24.1% of Dublin households rented from a private landlord in 2022, against 18.0% nationally, according to the CSO’s table F2004. A further 9.5% rented from a local authority and 2.1% from a voluntary body.
Ownership is correspondingly lower. 28.6% of Dublin households owned their home with a mortgage and 29.8% owned outright, a combined 58.4%, against 65.9% across Ireland, calculated from the same table. The gap is almost entirely in outright ownership, at 29.8% in Dublin against 37.0% nationally.
Energy Ratings by Dublin Postal District
By the end of September 2026, 427,152 homes in Dublin had received a Building Energy Rating, 30.4% of all rated homes in Ireland, according to the CSO’s Domestic Building Energy Ratings Q3 2026 release. Across Dublin, 23.3% of rated homes are A0 or A and 6.8% are F or G, against 19.3% and 8.8% nationally, calculated from the CSO’s table EBQ03.
Those averages hide a wide spread between postal districts. The newer suburbs at the edge of the city have the best ratings, and the older inner suburbs have the worst.
| Area | Homes with a BER | Rated A0 or A | Rated F or G |
|---|---|---|---|
| Dublin 1 | 12,033 | 21% | 9% |
| Dublin 2 | 6,609 | 17% | 8% |
| Dublin 3 | 12,432 | 13% | 15% |
| Dublin 4 | 15,058 | 16% | 9% |
| Dublin 5 | 12,921 | 9% | 9% |
| Dublin 6 | 11,673 | 9% | 19% |
| Dublin 6W | 7,197 | 15% | 11% |
| Dublin 7 | 17,223 | 11% | 18% |
| Dublin 8 | 19,978 | 12% | 13% |
| Dublin 9 | 17,371 | 22% | 11% |
| Dublin 10 | 6,256 | 18% | 9% |
| Dublin 11 | 17,514 | 18% | 6% |
| Dublin 12 | 16,889 | 16% | 12% |
| Dublin 13 | 13,442 | 33% | 4% |
| Dublin 14 | 13,516 | 17% | 8% |
| Dublin 15 | 32,488 | 26% | 1% |
| Dublin 16 | 13,709 | 18% | 3% |
| Dublin 17 | 6,572 | 24% | 2% |
| Dublin 18 | 20,776 | 45% | 1% |
| Dublin 20 | 4,125 | 27% | 5% |
| Dublin 22 | 14,089 | 32% | 3% |
| Dublin 24 | 26,027 | 25% | 3% |
| Rest of County Dublin | 109,254 | 30% | 4% |
| All rated homes in Ireland | 1,407,196 | 19.3% | 8.8% |
Source: CSO, Domestic Building Energy Ratings, table EBQ03, cumulative to Q3 2026. “Rest of County Dublin” covers rated homes outside the numbered postal districts. Shares calculated by Expert Windows. Not every home has a rating, so rated homes are not a random sample of all homes.
Dublin 18 has the highest share of A ratings, at 45%, followed by Dublin 13 (33%) and Dublin 22 (32%). At the other end, 19% of rated homes in Dublin 6 and 18% in Dublin 7 are F or G, followed by Dublin 3 (15%), Dublin 8 (13%) and Dublin 12 (12%). In Dublin 6 and Dublin 7, more than half of rated homes (53%) are D or below.
Heating is different too. Mains gas is the main heating fuel in 60.2% of rated Dublin homes, against 33.4% nationally, while heating oil is used in only 5.7%, against 33.7% nationally. Group or district heating serves 5.1% of rated Dublin homes, nearly three times the national share of 1.8%, all calculated from table EBQ03. The national energy rating picture is on our home energy efficiency statistics page.
What Dublin Is Building
Dublin completed 13,681 new homes in 2025, 37.8% of the 36,215 completed in Ireland, calculated from the CSO’s table NDQ05. That was up from 10,879 in 2024 and roughly double the 6,890 completed in 2019. Dublin City Council’s area completed the most in 2025, with 4,519, followed by Fingal (3,607), South Dublin (3,516) and Dún Laoghaire-Rathdown (2,039).
The pace slowed in 2026. Dublin completions fell 16.4% in the second quarter compared with the same quarter of 2025, the largest regional fall in the country, although Dublin still accounted for over a third (36%) of national completions, according to the CSO’s Q2 2026 release. Cabra-Glasnevin was the busiest local electoral area in Ireland that quarter, with 465 completions.
| Dublin local electoral area | Completions, 12 months to June 2026 |
|---|---|
| Clondalkin, South Dublin | 1,851 |
| North Inner City, Dublin City | 1,341 |
| Cabra-Glasnevin, Dublin City | 1,085 |
| Lucan, South Dublin | 1,045 |
| Rush-Lusk, Fingal | 1,001 |
Source: CSO, New Dwelling Completions by Local Electoral Area, table NDQ09, Q3 2025 to Q2 2026. Totals calculated by Expert Windows.
More is on the way. GeoDirectory recorded 6,107 residential buildings under construction in Dublin in June 2026, the most of any county, and 12,524 new Dublin addresses in the previous twelve months, over a third of the national total, according to its Q2 2026 report. The same report, using CSO data, put the average Dublin home price at €596,997 in the twelve months to May 2026, with Dublin 6 the highest district at €1,019,942.
Vacant Homes in Dublin
Dublin has less vacancy than anywhere else in Ireland. GeoDirectory put Dublin’s vacancy rate at 1.4% in June 2026, the lowest of any county. On the CSO’s electricity-based measure, South Dublin (0.9%) and Fingal (1.1%) had the lowest vacancy rates of any local authority at the end of 2024, although Dublin City still had 5,670 vacant homes, the second-highest number after Cork County, according to the CSO’s 2024 vacancy release.
The 2022 census counted 31,658 vacant homes in Dublin, excluding holiday homes, with vacancy rates of 7.2% in Dublin City, 5.2% in Dún Laoghaire-Rathdown, 4.2% in Fingal and 3.7% in South Dublin, against 7.7% nationally, according to CSO tables F2014 and F2027. The reasons differ from the rest of the country. Rental properties between tenants made up 27.1% of vacant Dublin homes (20.6% nationally) and renovation 17.0% (14.2% nationally), while vacancy after the owner’s death was much less common, at 9.4% against 16.7%. National vacancy and dereliction figures are on our vacant homes statistics page.
Burglary and Fires in Dublin
Burglary in Dublin has fallen sharply over the past decade. Gardaí recorded 3,790 burglaries and related offences in the six divisions of the Dublin Metropolitan Region in 2025, down 57% from 8,898 in 2016, calculated from the CSO’s table CJQ06. The region still accounted for 44.8% of all burglaries recorded in Ireland in 2025. The South Central division recorded the most, with 767, and the Eastern division the fewest, with 490. The national trend and how burglars get in are covered on our burglary statistics page.
Dublin Fire Brigade, run by Dublin City Council, attended 10,599 fires in 2025, 48.6% of all fires attended in Ireland, including 1,046 fires in homes, according to the Department of Housing’s Locations of Fires 2025 table. Fire deaths and escape window rules are on our house fire statistics page.
Using and Citing These Figures
Three points help when quoting these statistics. First, “Dublin” here means the four local authorities of County Dublin, except for crime, where the Dublin Metropolitan Region is a Garda area that does not exactly match the county boundary. Second, the BER figures cover only homes that have been rated (427,152 in Dublin by September 2026, against 565,321 homes counted in 2022), so they describe rated homes rather than every home. Third, the census figures date from April 2022, while the completions, energy rating, vacancy and crime figures are the latest published in 2025 and 2026.
Journalists, researchers and property professionals are welcome to use the figures and the infographic on this page. Please credit Expert Windows with a link to this page, and cite the original source named beside each figure.
Method and Sources
The figures on this page were compiled in October 2026, mainly from CSO open data tables pulled through the PxStat API with every dimension set explicitly: Census 2022 tables F2021 (housing stock), FY033A (households by type and period built), F2004 (tenure), F2014 (vacancy reasons) and F2027 (vacancy rates); Domestic Building Energy Ratings table EBQ03 (Q3 2026, released 23 October 2026); New Dwelling Completions tables NDQ05 and NDQ09 (to Q2 2026) and the Q2 2026 release; and Recorded Crime table CJQ06 (to Q4 2025). They also draw on the CSO’s Residential Vacancy Based on Metered Electricity Consumption 2024, GeoDirectory’s Residential Buildings Report for Q2 2026, and the Department of Housing’s Locations of Fires 2025 table. Dublin totals, shares, changes and postal district percentages were calculated by Expert Windows from these tables and are labelled as such. Every figure was checked against its source before publication, and the page will be updated as each source publishes new figures.
How Expert Windows Helps
Expert Windows is based in Dublin and replaces windows and doors in homes across the city and county. Many Dublin homes have the original glazing of a mid-century estate, a Victorian terrace or an older apartment block. We supply and fit replacement windows, sash windows for period homes and apartment windows and doors, including areas such as Dublin 7 and Dublin 12. To arrange a survey, contact us for a quotation.