Skip to content


Last updated: November 2026. Human written and fact checked against each named source.
Heating Irish homes produced 5.21 million tonnes of greenhouse gases in 2025, the lowest level since records began in 1990, yet Irish households still emit more per person from home heating than almost anywhere else in the European Union. This page gathers the current statistics on home carbon emissions in Ireland in one place: how much homes emit, how emissions per household have changed, how Ireland compares with the EU, how homes are heated, how fast heat pumps are spreading, and how close the sector is to its climate targets, with every figure linked to its primary source.
Key Home Carbon Emissions Statistics for Ireland at a Glance
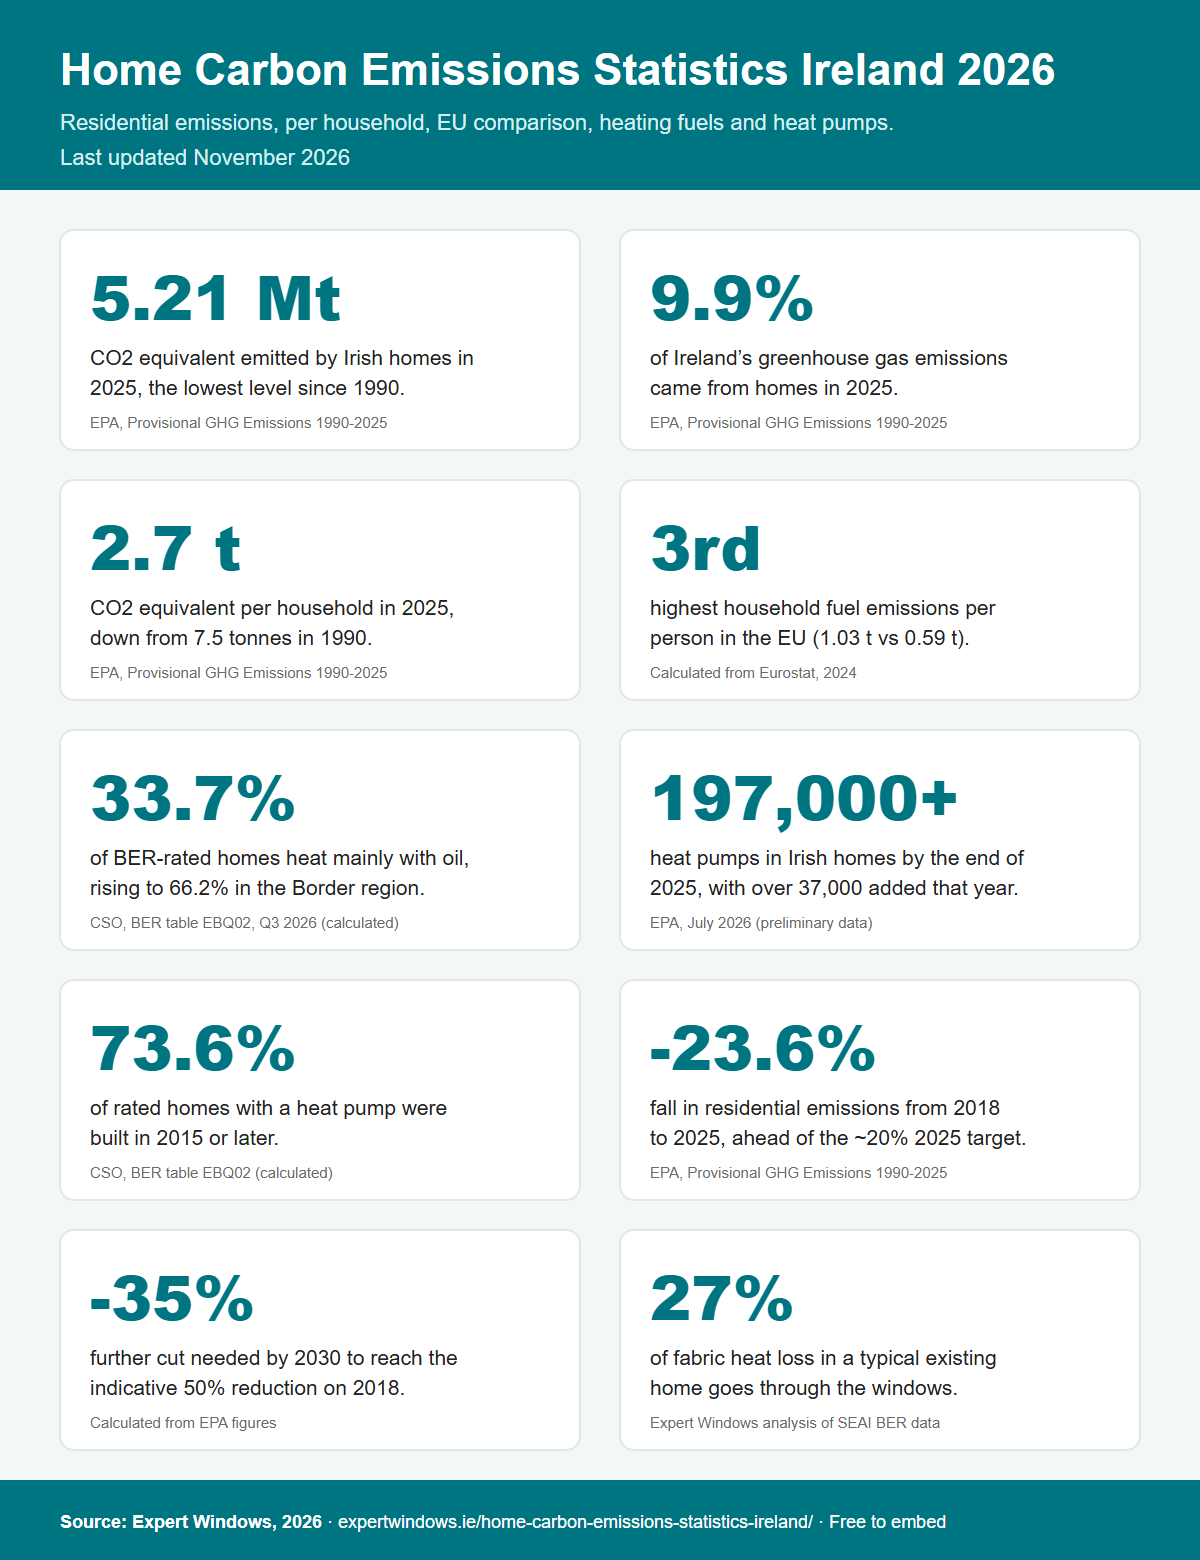
- Irish homes emitted 5.21 million tonnes of CO2 equivalent in 2025, down 5.0% on 2024 and the lowest level since 1990. Source: EPA, Ireland’s Provisional Greenhouse Gas Emissions 1990-2025
- Homes accounted for 9.9% of Ireland’s total greenhouse gas emissions in 2025. Source: EPA, July 2026
- Emissions per household fell to 2.7 tonnes of CO2 equivalent in 2025, from 7.5 tonnes in 1990. Source: EPA, July 2026
- Residential emissions are 31.1% below 1990 levels, even though the number of households has grown by 92.7% since then. Source: EPA, July 2026
- Ireland’s household fuel emissions were 1.03 tonnes per person in 2024, the third highest in the EU and 75% above the EU average of 0.59 tonnes. Source: calculated from Eurostat, table env_air_gge and Eurostat population table demo_pjan
- Heating oil is the main heating fuel in 33.7% of BER-rated homes, and in 66.2% in the Border region. Source: CSO Domestic Building Energy Ratings, table EBQ02, Q3 2026 (shares calculated)
- Over 37,000 heat pumps were installed in Irish homes in 2025, bringing the total to over 197,000 (preliminary data). Source: EPA, July 2026
- Residential emissions have fallen 23.6% since 2018, ahead of the indicative 20% reduction set for 2025. Source: EPA, July 2026
- A further cut of about 35% is needed by 2030 to reach the indicative 50% reduction on 2018 levels. Source: calculated from EPA, July 2026
- Windows account for 27% of the heat lost through the walls, roof, floor, windows and doors of a typical existing home. Source: Expert Windows analysis of SEAI BER data
How Much Irish Homes Emit
The Environmental Protection Agency counts the greenhouse gases released when homes burn fuel for space and water heating, mainly oil, gas, coal and peat. In its EPA, Ireland’s Provisional Greenhouse Gas Emissions 1990-2025 report, published in July 2026, it put residential emissions at 5.21 million tonnes of CO2 equivalent (Mt CO2eq) in 2025, or 9.9% of the national total.
| Year | Residential emissions (Mt CO2eq) |
|---|---|
| 1990 | 7.57 |
| 1995 | 6.41 |
| 2000 | 6.94 |
| 2005 | 8.16 |
| 2010 | 8.86 |
| 2015 | 6.64 |
| 2018 | 6.82 |
| 2020 | 7.19 |
| 2021 | 6.71 |
| 2022 | 5.62 |
| 2023 | 5.23 |
| 2024 | 5.49 |
| 2025 | 5.21 |
Source: EPA, Ireland’s Provisional Greenhouse Gas Emissions 1990-2025, Table A.1 and Table 2. 2025 figures are provisional.
Residential emissions peaked at 8.86 Mt in 2010 and have fallen 41.2% since then, calculated from the table above. The last three years are the three lowest on record, according to the EPA. Emissions reached 7.19 Mt in 2020, the first year of the pandemic and the highest since 2011, and rose again in 2024, which the EPA attributes to a colder winter.
Weather drives much of the year-to-year change. The EPA reports that 2025 had 4.1% fewer heating degree days than 2024, and that household use of coal, oil and gas fell by 13.5%, 4.8% and 5.2% respectively, while energy used by heat pumps rose by 21.9%.
Emissions per Household
Because the number of homes has grown so much, emissions per household show the change more clearly. The EPA estimates that emissions per household fell from 7.5 tonnes of CO2 equivalent a year in 1990 to 3.6 tonnes in 2014, through fuel switching from coal and peat to oil and gas and through better building regulations. From 2015 to 2021 they averaged 3.7 tonnes a year.
In 2025 they fell to 2.7 tonnes per household, the lowest since 1990, which the EPA attributes to further fuel switching away from fossil fuels, more heat pumps and the expansion of energy efficiency programmes. Over the same 35 years the number of households grew by 92.7% and the population by 55.7%, according to the EPA, July 2026 report.
How Ireland Compares With the EU
Eurostat publishes each country’s emissions from fuel burned in homes on the same basis. Dividing those figures by population shows that Ireland’s household emissions are among the highest in the EU.
| Country | Household fuel emissions per person, 2024 (tonnes CO2eq) |
|---|---|
| Luxembourg | 1.34 |
| Belgium | 1.07 |
| Ireland | 1.02 |
| Germany | 0.93 |
| Poland | 0.79 |
| Hungary | 0.69 |
| Italy | 0.67 |
| Netherlands | 0.63 |
| France | 0.47 |
| Spain | 0.29 |
| Sweden | 0.04 |
| EU27 | 0.58 |
Source: calculated by Expert Windows from Eurostat, table env_air_gge (fuel combustion by households, CRF 1A4b, 2024) and Eurostat population table demo_pjan (1 January 2024). Selected countries shown; Ireland ranks third of 27.
Irish households emitted 1.03 tonnes per person from home heating fuels in 2024, 75% above the EU average and behind only Luxembourg and Belgium. Countries with low figures, such as Sweden and Finland, heat most homes with electricity or district heating, whose emissions are counted under power generation rather than households. The comparison therefore reflects how homes are heated as much as how much heat they use.
How Irish Homes Are Heated
Ireland’s high figure reflects its reliance on oil. Of the 1,407,196 homes with a Building Energy Rating at the end of September 2026, heating oil was the main heating fuel in 33.7%, mains gas in 33.4% and electricity in 26.3%, with solid fuel in 3.5%, calculated from the CSO Domestic Building Energy Ratings Q3 2026 release (table EBQ02).
| Main heating fuel | Share of rated homes | Rated A0 or A | Rated F or G |
|---|---|---|---|
| Heating oil | 33.7% | 2.4% | 9.3% |
| Mains gas | 33.4% | 8.2% | 4.2% |
| Electricity (including heat pumps) | 26.3% | 55.6% | 8.8% |
| Solid fuel | 3.5% | 0.3% | 52.0% |
| Group or district heating | 1.8% | 59.2% | 5.7% |
| LPG | 1.3% | 3.5% | 3.4% |
Source: CSO Domestic Building Energy Ratings Q3 2026, table EBQ02, cumulative to Q3 2026. Shares calculated by Expert Windows.
Oil dominates outside the cities. It is the main heating fuel in 66.2% of rated homes in the Border region, 59.8% in the West and 48.7% in the Midlands, against 5.7% in Dublin. Solid fuel homes have the poorest ratings: 52.0% of rated homes heated mainly by solid fuel are rated F or G. Fuel prices and running costs are covered on our home heating costs statistics page.
Heat Pumps and the Move Away From Fossil Fuels
Preliminary data show that over 37,000 heat pumps were installed in Irish homes in 2025, bringing the total to over 197,000, according to the EPA, July 2026 report. Among BER-rated homes, 208,142 had a heat pump at the end of September 2026, up from 53,662 at the end of 2021, calculated from CSO Domestic Building Energy Ratings, table EBQ02. That is 14.8% of all rated homes.
| End of period | Rated homes with a heat pump | Share of all rated homes |
|---|---|---|
| 2021 | 53,662 | 5.5% |
| 2022 | 80,949 | 7.6% |
| 2023 | 112,272 | 9.8% |
| 2024 | 144,411 | 11.7% |
| 2025 | 180,048 | 13.5% |
| September 2026 | 208,142 | 14.8% |
Source: CSO Domestic Building Energy Ratings, table EBQ02, homes with a heat pump only or a heat pump and solar panels. Shares calculated by Expert Windows.
Most heat pumps are in new homes. 73.6% of rated homes with a heat pump were built in 2015 or later, and 79.0% of rated homes built between 2020 and 2024 have one, calculated from the same table. Among older homes the share is far lower: 4.5% of rated homes built before 1950 and 4.2% of those built between 1978 and 1999 have a heat pump.
Heat pumps work best in airtight, well-insulated homes, which is why retrofits usually start with the building fabric. The national picture on energy ratings and retrofits is on our home energy efficiency statistics page.
Climate Targets and Carbon Budgets
Under the Climate Action Plan, the government set sectoral emissions ceilings for each sector over 2021 to 2025. Residential buildings had a ceiling of 29.0 Mt for the five years and used 28.26 Mt, or 97.4%, keeping within it, according to the EPA, July 2026 report. The sector was one of four to stay within its ceiling, while electricity, transport and industry exceeded theirs.
Residential emissions fell 23.6% between 2018 and 2025, from 6.82 Mt to 5.21 Mt, ahead of the indicative reduction of about 20% by 2025. The indicative target for 2030 is about 50% below 2018, or roughly 3.4 Mt, which would require a further cut of about 35% from the 2025 level in five years, calculated from the same report. Nationally, Ireland used 99.6% of its first five-year carbon budget, and the EPA says annual reductions of over 10% are needed to 2030 to reach the national 51% target, according to the EPA news release and report.
The second carbon budget, for 2026 to 2030, is set at 200 Mt CO2eq for the whole economy, against 295 Mt for 2021 to 2025, and only 1.1 Mt of the first budget was left over to carry forward, according to the EPA. The residential sector will need to keep cutting at its recent pace, and faster, for the national budget to be met.
Where Windows Fit In
Cutting the heat a home needs is the other half of cutting its emissions. Expert Windows’ analysis of 1.42 million SEAI Building Energy Ratings found that windows account for 27% of the heat lost through the walls, roof, floor, windows and doors of a typical existing home, and that only 6.7% of rated existing homes have windows meeting the 1.4 W/m²K standard in the 2019 Building Regulations. The full analysis is on our windows and doors statistics page.
Lower heat loss means less fuel burned in an oil or gas home and a smaller, more efficient heat pump in an electric one. How heat loss translates into bills is covered on our household energy bills statistics page.
Using and Citing These Figures
Three points help when quoting these statistics. First, residential emissions in the EPA inventory and in Eurostat cover fuel burned in homes for space and water heating; emissions from electricity used in homes are counted under power generation, so homes heated by electricity appear to have no direct emissions. Second, the 2025 figures are provisional and will be revised in the EPA’s final inventory. Third, the heating fuel and heat pump shares describe BER-rated homes, not every home.
Journalists, researchers and climate groups are welcome to use the figures and the infographic on this page. Please credit Expert Windows with a link to this page, and cite the original source named beside each figure.
Method and Sources
The figures on this page were compiled in November 2026 from the EPA’s Ireland’s Provisional Greenhouse Gas Emissions 1990-2025 (July 2026), including its residential chapter, sectoral emissions ceiling and reduction tables and Table A.1; Eurostat table env_air_gge (greenhouse gas emissions from fuel combustion by households, 2024) and table demo_pjan (population on 1 January 2024), both pulled through the Eurostat API with every dimension set explicitly; CSO table EBQ02 (Domestic Building Energy Ratings by heating fuel, region and renewable energy, Q3 2026); and Expert Windows’ own analysis of the SEAI BER Research Tool dataset (published 3 November 2026). Per-person emissions and EU ranking, the change since 2010, the implied 2030 level and the fuel and heat pump shares were calculated by Expert Windows and are labelled as such. The Eurostat figure for Ireland in 2024 (5.48 Mt) matches the EPA’s, which cross-checks the two sources. Every figure was checked against its source before publication, and the page will be updated when the EPA publishes its final 1990-2025 inventory.
How Expert Windows Helps
Replacing old windows and doors is one of the most direct ways to cut the heat a home loses. Expert Windows supplies and fits double glazed and triple glazed windows and energy-efficient entrance doors across Dublin and the surrounding counties. Our window replacement team can survey your home and provide a quotation.