Skip to content

Last updated: September 2026. Human written and fact checked against each named source.
Irish households pay more for electricity than anyone else in the European Union, and in the spring of 2026 they lived through the sharpest home heating oil shock the Central Statistics Office has ever recorded. This page gathers the current figures on Irish home heating costs and energy prices in one place: what each fuel costs per unit of heat, how prices have moved, how Ireland compares with the rest of the EU, and which fuels Irish homes actually run on, with every figure linked to its primary source.
Key Home Heating Cost Statistics for Ireland at a Glance
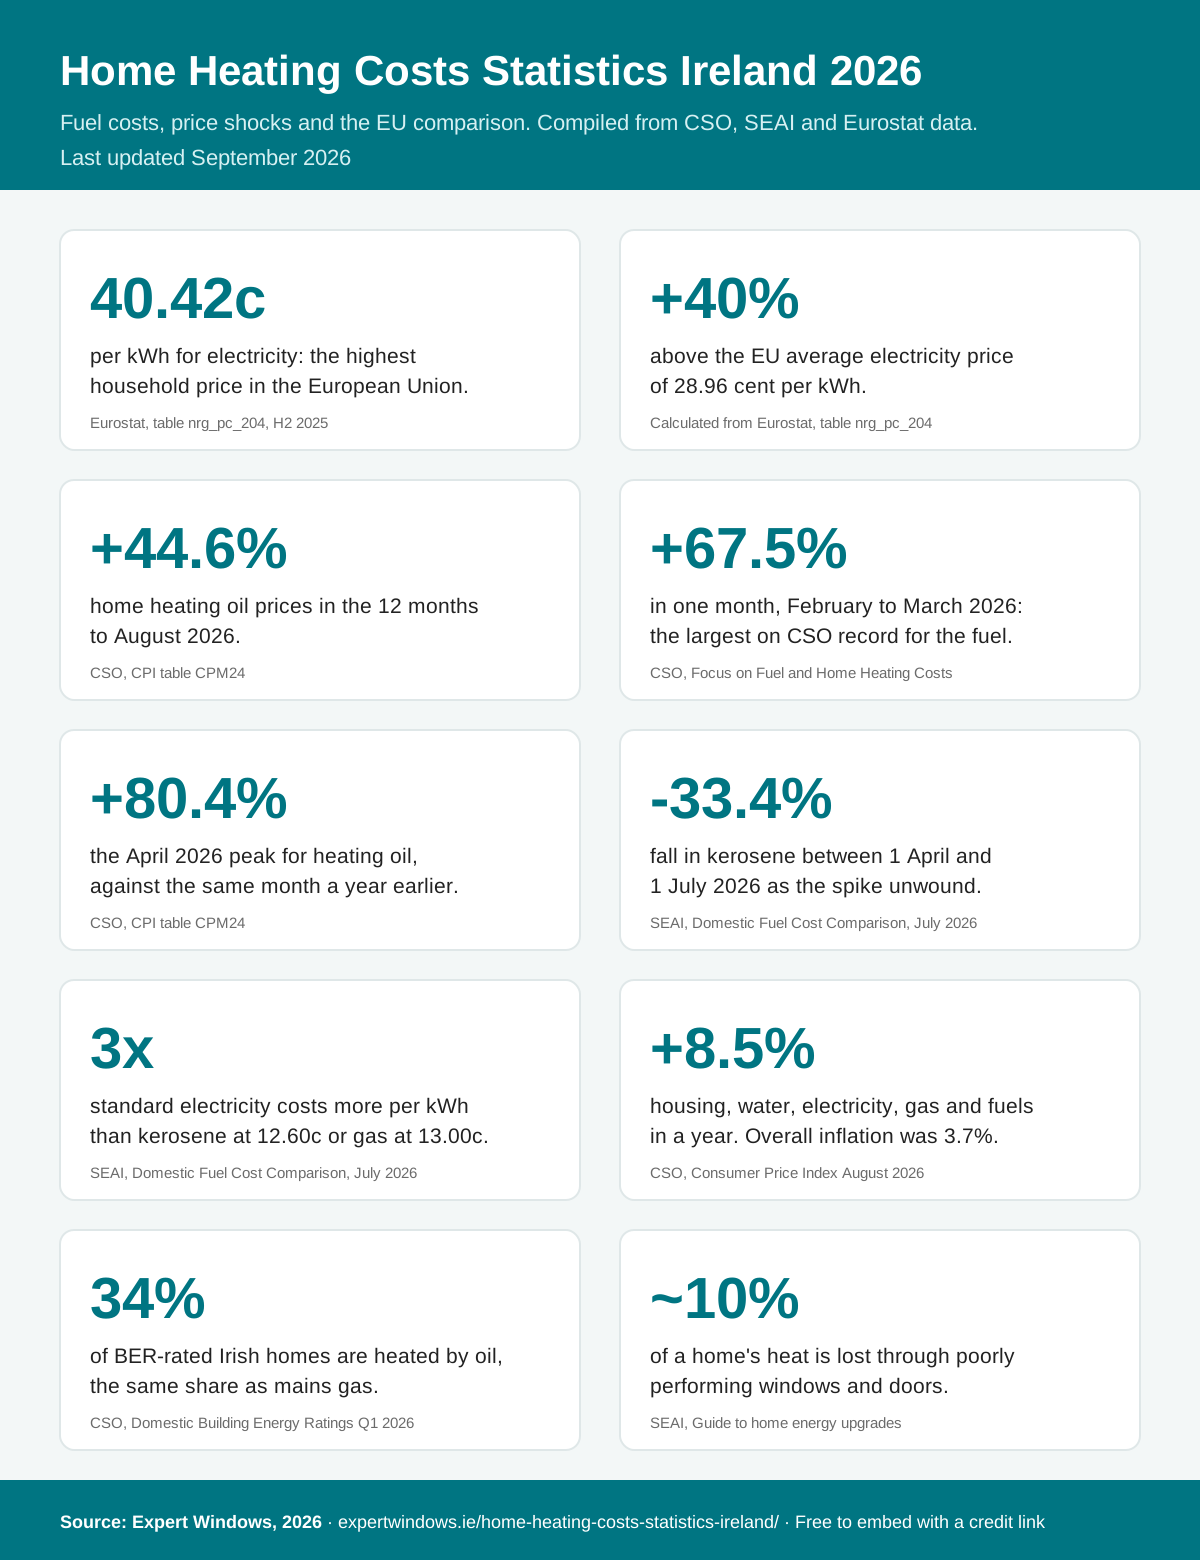
- Ireland has the highest household electricity price in the EU at 40.42 cent per kWh, against an EU average of 28.96 cent. Source: Eurostat, table nrg_pc_204
- That is roughly 40% above the EU average, and ahead of second-placed Germany at 38.69 cent. Calculated from Eurostat, table nrg_pc_204
- Home heating oil prices rose 44.6% in the 12 months to August 2026. Source: CSO, CPI table CPM24
- In March 2026, home heating oil rose 67.5% in a single month, the largest month-on-month increase the CSO has recorded. Source: CSO, Focus on Fuel and Home Heating Costs, April 2026
- Home heating oil peaked in April 2026 at 80.4% above its year-earlier level. Source: CSO, CPI table CPM24
- Housing, water, electricity, gas and other fuels rose 8.5% in the 12 months to August 2026, against overall inflation of 3.7%. Source: CSO, Consumer Price Index August 2026
- Electricity prices rose 8.1% and gas 2.3% in the 12 months to August 2026. Source: CSO, CPI table CPM24
- Kerosene costs 12.60 cent per kWh delivered, against 13.00 cent for natural gas and 40.42 cent for standard-rate electricity. Source: SEAI, Domestic Fuel Cost Comparison, 1 July 2026
- Kerosene fell 33.4% between 1 April and 1 July 2026 as the spring spike unwound. Source: SEAI, July 2026
- Heating oil and mains gas each heat 34% of Ireland’s BER-rated homes, with electricity at 25%. Source: CSO, Domestic Building Energy Ratings Q1 2026
What Each Heating Fuel Costs
The fairest way to compare heating fuels is by the cost of delivered heat rather than the price on the pump or the bill, because a litre of oil, a kilogram of pellets and a unit of electricity each carry different amounts of usable energy. SEAI publishes that comparison quarterly. These are the figures from its Domestic Fuel Cost Comparison dated 1 July 2026, all inclusive of VAT:
| Fuel | Delivered energy cost | Change since 1 April 2026 |
|---|---|---|
| Coal, low smoke ovoids | 9.45 cent per kWh | No change |
| Kerosene, typical discounted price | 11.72 cent per kWh | Down 31.9% |
| Kerosene, schedule price | 12.60 cent per kWh | Down 33.4% |
| Natural gas, typical household band | 13.00 cent per kWh | Reviewed every six months |
| Electricity, night rate | 15.42 cent per kWh | Reviewed every six months |
| Electricity, standard household band | 40.42 cent per kWh | Reviewed every six months |
The gap is the story. Standard-rate electricity costs more than three times as much per unit of heat as kerosene at its July price, which is why direct electric heating remains expensive to run in Ireland and why heat pumps, which deliver several units of heat per unit of electricity, are the form of electric heating that makes economic sense. Night-rate electricity at 15.42 cent sits much closer to the fossil fuels, but it requires a second meter and only covers off-peak hours.
The natural gas figure shown is SEAI’s Band D2, covering annual consumption between 5,556 and 55,556 kWh, which is where a typical Irish household sits. Smaller gas users in Band D1 pay 16.41 cent per kWh, because standing charges are spread across fewer units.
The 2026 Home Heating Oil Shock
Home heating oil had an extraordinary year, and the CSO’s monthly price index shows how extreme it was. Figures from CPI table CPM24, which indexes December 2023 at 100, track the whole episode:
| Month, 2026 | Price index | Change on same month a year earlier |
|---|---|---|
| January | 92.0 | Down 7.9% |
| February | 93.3 | Down 7.3% |
| March | 156.3 | Up 63.3% |
| April | 167.4 | Up 80.4% |
| May | 141.5 | Up 60.1% |
| June | 130.1 | Up 48.7% |
| July | 122.2 | Up 28.0% |
| August | 134.6 | Up 44.6% |
Home heating oil entered 2026 cheaper than it had been a year before, then rose 67.5% in the single month between February and March, the largest month-on-month increase the CSO has recorded for the fuel, exceeding even the 58.4% jump of March 2022. The CSO’s Focus on Fuel and Home Heating Costs release noted that March took the sub-index to its highest level since the CSO began publishing detailed price sub-indices in November 1996.
The spike peaked in April at 80.4% above the previous year, unwound through the summer as SEAI’s quarterly comparison confirms, and then turned back up in August. Even at August’s level, oil sat 46% above where it started the year, a figure calculated from the index values in the table above.
Because oil is bought in bulk fills rather than metered monthly, the timing of a delivery in 2026 mattered more than usual. A household that filled a 1,000 litre tank in April paid close to the highest real price on record; one that filled in July paid roughly a quarter less.
Electricity, Gas and the Wider Inflation Picture
Oil was the outlier, but it was not alone. The CSO’s Consumer Price Index for August 2026, published on 10 September 2026, put annual inflation at 3.7% and identified housing, water, electricity, gas and other fuels as the second-largest contributor at 8.5%, behind only education services. The CSO attributed that rise to higher prices for home heating oil, electricity, rents and mortgage interest repayments.
Within the energy group, the 12 months to August 2026 produced sharply different outcomes by fuel, according to table CPM24: electricity up 8.1%, gas up 2.3%, solid fuels up 0.8% and home heating oil up 44.6%. Taken together, electricity, gas and other fuels rose 11.9%. August was also the second consecutive month in which every one of the 13 CPI divisions recorded an annual increase, something the CSO notes had never happened before July 2026, including during the high inflation of 2022 and 2023.
How Ireland Compares With the EU
On electricity, Ireland is not merely expensive but the most expensive country in the European Union. Eurostat’s household electricity price data for the second half of 2025, covering the standard consumption band of 2,500 to 4,999 kWh a year and including all taxes and levies, puts Ireland at 40.42 cent per kWh against an EU average of 28.96 cent.
| Country | Household electricity price, cent per kWh |
|---|---|
| Ireland | 40.42 |
| Germany | 38.69 |
| Belgium | 34.99 |
| Denmark | 33.12 |
| Austria | 32.72 |
| EU average | 28.96 |
Figures from Eurostat table nrg_pc_204, second half of 2025, all taxes included. Ireland’s position at the top of the table is calculated by Expert Windows from the same dataset across all 38 reporting countries.
Ireland’s electricity price is roughly 40% above the EU average, a derived figure from the two numbers above. The gap has also widened quickly: Irish household electricity was 25.90 cent per kWh in the first half of 2024, below the EU average of 29.16 cent at that time, and has risen in every subsequent half-year while the EU average has barely moved.
For what these prices add up to over a year, including indicative bills for a typical home and the record number of households now in arrears, see our household energy use and bills statistics.
Which Fuels Irish Homes Actually Use
Exposure to these price movements depends on what is in the boiler house. According to the CSO’s Domestic Building Energy Ratings release for Q1 2026, mains gas and heating oil each serve as the main space heating fuel in 34% of Ireland’s BER-rated dwellings, with electricity at 25%.
The split is strongly regional. Gas heats 61% of rated homes in Dublin and 39% in the Mid-East, while oil dominates everywhere else, reaching 72% of rated homes in Donegal, 68% in Mayo and 67% in Roscommon. In practice this means the 2026 oil shock landed hardest outside the cities, a pattern reflected in reporting by RTÉ in September 2026, which noted that the households most exposed to heating oil costs are disproportionately older, lower-income and rural.
Policy and What Changes Next
Government measures shaped the 2026 picture and are due to change again. The CSO noted that its March prices were collected before the Government’s energy cost measures took effect, so the announced reductions in mineral oil tax are not reflected in the March spike. Those temporary fuel supports are due to unwind from 1 November 2026, and the Government has signalled a possible Budget measure on home heating oil, either through carbon tax or by aligning its 13.5% VAT rate with the 9% rate applied to gas and electricity, according to RTÉ. The reduced 9% VAT rate on gas and electricity has been retained.
Carbon tax continues its scheduled climb, rising to €71 per tonne of carbon dioxide, applied to home heating fuels from 1 May 2026. Because that tax falls on the fossil fuels that heat two thirds of Irish homes and not on electricity, the long-term direction of travel favours fabric efficiency and electrified heating.
What the Numbers Mean for Heating a Home
Two conclusions follow from the data. The first is that the cheapest unit of heat in Ireland is the one a home does not need, and that argument is stronger here than anywhere else in the EU because Ireland pays the highest electricity price in the bloc and has just lived through a 44% annual rise in the fuel that heats a third of its homes. SEAI’s guidance puts heat loss through poorly performing windows and doors at about 10% of a home’s total, with up to 30% going through poorly insulated roofs and walls.
The second is that volatility itself is a cost. A household on oil saw its fuel move from 8% cheaper than the previous year in January to 80% more expensive in April. Fabric improvements do not move with the commodity market, so every unit of demand removed from a home is a unit that cannot be repriced by events outside it.
The age of the housing stock sets how much room there is to improve. As our Irish housing stock statistics page shows, 65% of occupied Irish homes were built before 2001, and our home energy efficiency statistics page shows that two thirds of BER-rated homes still fall below the B2 standard. For homes that already have good attic and wall insulation, the SEAI windows and doors grant covers part of the glazing upgrade, and the uptake figures are on our SEAI windows and doors grant statistics page.
Method and Sources
The figures on this page were compiled in September 2026 from the Central Statistics Office (Consumer Price Index August 2026, published 10 September 2026; the Focus on Fuel and Home Heating Costs insight release of 9 April 2026; CPI sub-index table CPM24, extracted via the CSO PxStat API; and Domestic Building Energy Ratings Q1 2026), the Sustainable Energy Authority of Ireland (Domestic Fuel Cost Comparison dated 1 July 2026 and home energy upgrade guidance), Eurostat (household electricity price table nrg_pc_204, extracted via the Eurostat API for the second half of 2025), and RTÉ’s report of 15 September 2026 on heating oil taxation. Figures described as calculated, including Ireland’s EU ranking and percentage gap, the change in oil prices across 2026, and the share of homes affected, were derived by Expert Windows from the cited tables. Fuel cost comparisons are national averages and actual household costs vary with supplier, tariff, delivery volume and location. Every figure was checked against its source before publication, and the page will be updated with each monthly CPI release and each quarterly SEAI fuel comparison.
How Expert Windows Helps
When a country pays the highest electricity price in Europe and a third of its homes run on a fuel that moved 80% in a year, the heat that escapes through old glazing is expensive heat. Expert Windows supplies and fits double glazed and triple glazed windows and energy-efficient external doors across Dublin and the surrounding counties, all meeting the 1.4 W/m²K U-value that SEAI requires for grant support. If you are planning a window replacement before the heating season, contact us for a survey and a quotation.