Skip to content


Last updated: November 2026. Human written and fact checked against each named source.
One in three new homes completed in Ireland is now an apartment, yet only 13.1% of households lived in one at the 2022 census. This page gathers the current statistics on apartments in Ireland in one place: how many households live in them, how fast they are being built and where, who owns and rents them, what they cost to rent, how many stand vacant, and how their energy ratings and windows compare with houses, with every figure linked to its primary source.
Key Apartment Statistics for Ireland at a Glance
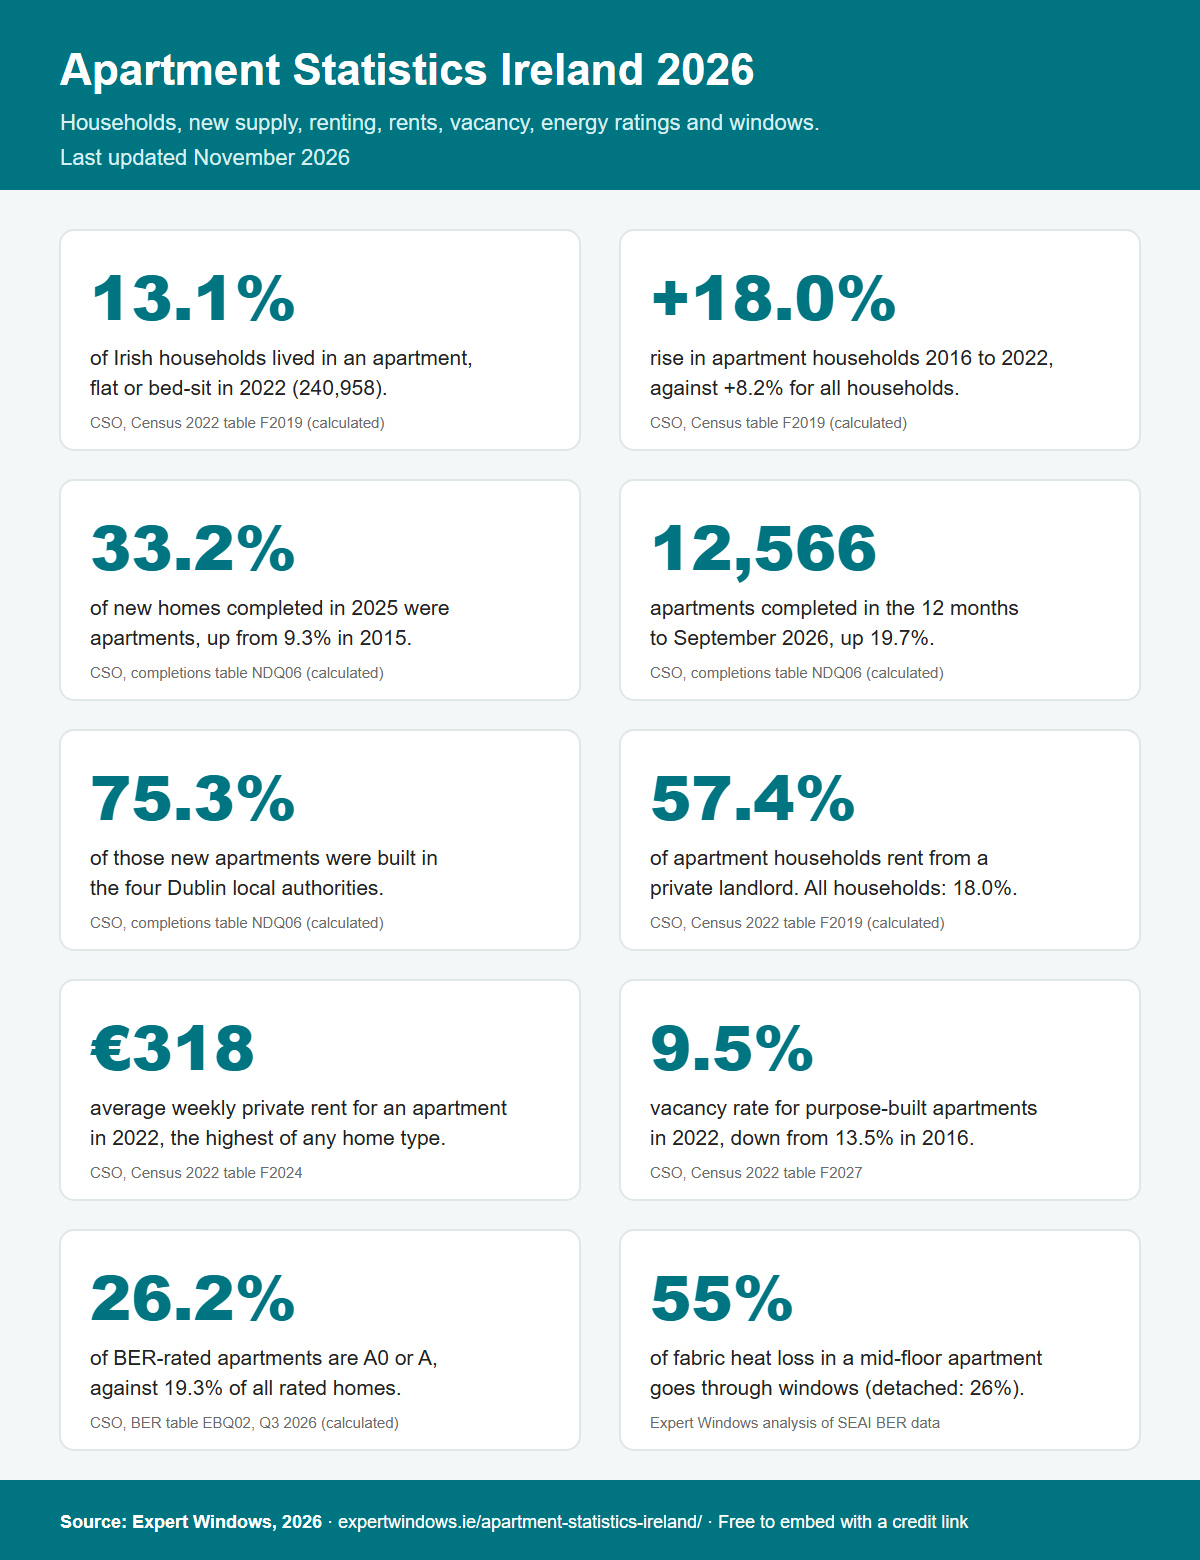
- 240,958 households, 13.1% of the total, lived in an apartment, flat or bed-sit in 2022. Source: CSO, Census 2022 table F2019 (share calculated)
- The number of households in apartments and flats rose 18.0% between 2016 and 2022, more than twice the 8.2% rise in all households. Source: CSO table F2019 (changes calculated)
- 12,039 apartments were completed in 2025, 33.2% of all new homes, up from 9.3% in 2015. Source: CSO New Dwelling Completions table NDQ06 (shares calculated)
- 12,566 apartments were completed in the twelve months to September 2026, up 19.7% on the year before. Source: CSO table NDQ06 (totals calculated)
- 75.3% of the apartments completed in the twelve months to September 2026 were in Dublin. Source: CSO table NDQ06 (share calculated)
- 57.4% of apartment and flat households rent from a private landlord, and apartments house 41.8% of all private renters. Source: CSO table F2019 (shares calculated)
- The average private rent for a purpose-built apartment was €318.06 a week in 2022, up 38.7% on 2016 and the highest of any home type. Source: CSO, Census 2022 table F2024 (change calculated)
- The vacancy rate for purpose-built apartments fell from 13.5% in 2016 to 9.5% in 2022. Source: CSO, Census 2022 table F2027
- 26.2% of BER-rated apartments are rated A0 or A, against 19.3% of all rated homes. Source: CSO Domestic Building Energy Ratings Q3 2026, table EBQ02 (shares calculated)
- Windows account for 55% of the fabric heat loss in a typical mid-floor apartment, against 26% in a detached house. Source: calculated by Expert Windows from SEAI BER data
How Many Irish Households Live in Apartments
The census counts households by the type of home they live in. Apartments in purpose-built blocks, flats in converted houses or commercial buildings and bed-sits together housed 240,958 households in April 2022, according to the CSO’s table F2019.
| Census year | Households in apartments, flats and bed-sits | Share of all households | Of which purpose-built apartments |
|---|---|---|---|
| 2011 | 183,282 | 11.1% | 149,921 |
| 2016 | 204,145 | 12.0% | 172,096 |
| 2022 | 240,958 | 13.1% | 190,197 |
Source: CSO Census of Population, table F2019, private households in permanent housing units. Shares calculated by Expert Windows.
The share has grown at every census, from 11.1% in 2011 to 13.1% in 2022, but Ireland remains a country of houses. Apartment living is concentrated in the capital: 27.0% of Dublin households lived in an apartment, flat or bed-sit in 2022, as our Dublin home statistics show.
Apartments in New Housing Supply
Apartments have gone from a small part of new building to a third of it. The CSO counts new homes by the date they connect to the electricity network, split into single houses, scheme houses and apartments.
| Year | Apartments completed | All new homes | Apartment share |
|---|---|---|---|
| 2015 | 673 | 7,219 | 9.3% |
| 2018 | 2,199 | 17,777 | 12.4% |
| 2019 | 3,418 | 21,013 | 16.3% |
| 2020 | 3,866 | 20,483 | 18.9% |
| 2021 | 5,070 | 20,443 | 24.8% |
| 2022 | 9,021 | 29,609 | 30.5% |
| 2023 | 11,522 | 32,463 | 35.5% |
| 2024 | 8,685 | 30,124 | 28.8% |
| 2025 | 12,039 | 36,215 | 33.2% |
| 12 months to September 2026 | 12,566 | 38,792 | 32.4% |
Source: CSO New Dwelling Completions, table NDQ06. Annual totals, twelve-month totals and shares calculated by Expert Windows.
Apartment completions peaked at 11,522 in 2023, 35.5% of the total, dipped in 2024, then rose to 12,039 in 2025. In the third quarter of 2026, 3,464 apartments were completed, up 9.8% on the same quarter of 2025 and 34% of all completions, according to the CSO New Dwelling Completions Q3 2026 release.
New apartments are overwhelmingly a Dublin story. In the twelve months to September 2026, 9,463 of the 12,566 apartments completed, or 75.3%, were in the four Dublin local authorities. In Dublin City Council’s area, 92.8% of all new homes were apartments (4,906 of 5,289). Outside Dublin, Cork City had the most, with 716.
| Local authority | Apartments completed, 12 months to September 2026 | All new homes | Apartment share |
|---|---|---|---|
| Dublin City | 4,906 | 5,289 | 92.8% |
| South Dublin | 1,805 | 3,478 | 51.9% |
| Fingal | 1,462 | 3,452 | 42.4% |
| Dún Laoghaire-Rathdown | 1,290 | 1,880 | 68.6% |
| Cork City | 716 | 1,839 | 38.9% |
| Kildare | 424 | 2,523 | 16.8% |
Source: CSO New Dwelling Completions, table NDQ06, Q4 2025 to Q3 2026. The six local authorities with the most apartment completions. Totals and shares calculated by Expert Windows.
Outside the four Dublin authorities and Cork City, apartments remain a small part of new building. In Kildare, the next highest, 16.8% of new homes completed in the period were apartments, and most counties built far fewer.
Who Lives in Apartments
Most apartment households rent. 57.4% of apartment, flat and bed-sit households rented from a private landlord in 2022, and 73.3% rented from a private landlord, a local authority or a voluntary body, according to the CSO’s table F2019.
| Tenure, 2022 | Apartment, flat and bed-sit households | All households |
|---|---|---|
| Owned with a mortgage | 10.1% | 28.9% |
| Owned outright | 6.8% | 37.0% |
| Rented from a private landlord | 57.4% | 18.0% |
| Rented from a local authority | 10.7% | 8.3% |
| Rented from a voluntary body | 5.2% | 1.6% |
Source: CSO Census 2022, table F2019. Shares calculated by Expert Windows; “occupied free of rent” and “not stated” are not shown.
Only 16.9% of apartment households own their home, against 65.9% of all households. Seen the other way, apartments house 41.8% of all private renting households and 41.8% of households renting from a voluntary body. Standards in rented homes, including the rules on windows, are covered on our damp, mould and housing quality statistics page.
How Old Ireland’s Apartments Are
Ireland’s apartment stock is young. 40.3% of apartment and flat households in 2022 lived in a building completed between 2001 and 2010, the largest single period, according to the CSO’s table F2019. A further 15.8% were built in the 1990s and 10.6% since 2011.
The exception is the oldest stock. 9.5% of apartment and flat households, 22,928, live in buildings from before 1919, and 73.9% of those are flats in converted houses or commercial buildings rather than purpose-built apartments (16,954 of 22,928), calculated from the same table. Apartments and flats make up 14.9% of all homes built before 1919 that are lived in today, compared with 4.1% of those built in the 1970s.
Purpose-built blocks dominate the 2000s stock: 92,492 of the 97,210 apartment and flat households in homes built between 2001 and 2010 were in purpose-built apartments. Where those blocks still have their original windows and balcony doors, they are now 15 to 25 years old. The age profile of all Irish homes is on our Irish housing stock statistics page.
Apartment Rents
The census records the weekly rent paid by every renting household. In 2022, private tenants in purpose-built apartments paid an average of €318.06 a week, the highest of any home type and 16.5% above the €273.07 average for all private rentals, calculated from the CSO’s table F2024.
| Home type (private landlord) | Average weekly rent, 2016 | Average weekly rent, 2022 |
|---|---|---|
| Purpose-built apartment | €229.29 | €318.06 |
| Terraced house | €209.52 | €286.48 |
| Semi-detached house | €192.75 | €259.24 |
| Detached house | €169.20 | €218.02 |
| All private rentals | €199.92 | €273.07 |
Source: CSO Census 2016 and 2022, table F2024. Rents are as reported by households in April of each census year.
Apartment rents are higher mainly because so many apartments are in Dublin and the cities, where rents are highest. For current rents in new tenancies, the RTB Rent Index published by the ESRI put the national standardised average at €1,839 a month in the first quarter of 2026, according to the ESRI.
Vacant Apartments
Apartment vacancy fell sharply between the last two censuses. The vacancy rate for purpose-built apartments dropped from 13.5% in 2016 to 9.5% in 2022, and for flats in converted buildings and bed-sits from 28.1% to 17.8%, according to the CSO’s table F2027. Both remain above the 7.7% rate for all homes and the 5.2% rate for semi-detached houses.
Census vacancy is a one-night count that includes homes between tenants, which partly explains the higher apartment figure, since so many apartments are rented. National vacancy and dereliction figures are on our vacant homes statistics page.
Energy Ratings and Heating
Apartments rate better than houses on average. 26.2% of the 279,658 BER-rated apartments in Ireland are rated A0 or A, and 43.4% are A or B, against 19.3% and 37.4% for all rated homes, calculated from the CSO’s CSO Domestic Building Energy Ratings Q3 2026 release (table EBQ02, cumulative to September 2026). 7.0% of rated apartments are F or G, compared with 11.7% of detached houses.
Apartments are heated differently too. Electricity is the main heating fuel in 57.1% of rated apartments, mains gas in 30.9% and group or district heating in 8.5%, while heating oil is used in only 2.0%. 14.1% of rated apartments have a heat pump, and 58.6% of all rated apartments are in the Dublin region.
Apartment Windows
Expert Windows’ analysis of 1.42 million ratings in the SEAI BER data shows how apartment windows compare with those of houses. All figures in this section were calculated by Expert Windows.
| Home type | Average window U-value (W/m²K) | Windows meeting the 1.4 standard | Average window area (m²) | Windows’ share of fabric heat loss |
|---|---|---|---|---|
| Mid-floor apartment | 2.11 | 36.0% | 13.1 | 55% |
| Top-floor apartment | 2.39 | 20.5% | 12.3 | 33% |
| Ground-floor apartment | 2.32 | 23.9% | 10.9 | 33% |
| Semi-detached house | 2.37 | 20.8% | 19.7 | 27% |
| Detached house | 2.50 | 13.2% | 30.5 | 26% |
Source: calculated by Expert Windows from the SEAI BER Research Tool dataset (published 3 November 2026), existing and new ratings combined. Fabric heat loss share is window U-value times area divided by the total for walls, roof, ground floor, windows and doors.
A mid-floor apartment has no roof and no ground floor exposed to the outside, so its windows carry far more of the job of keeping heat in. Windows account for 55% of the fabric heat loss in a typical mid-floor apartment, more than twice the 26% in a detached house. The full analysis, including figures by age and county, is on our windows and doors statistics page.
Using and Citing These Figures
Three points help when quoting these statistics. First, the census counts households, not buildings, and groups purpose-built apartments with flats in converted houses and bed-sits; where a figure refers to purpose-built apartments only, it says so. Second, the CSO counts new homes when they connect to the electricity network, so completions in a large block are recorded as the apartments are connected. Third, energy rating and window figures describe rated homes, which are not a random sample of all homes.
Journalists, researchers and housing groups are welcome to use the figures and the infographic on this page. Please credit Expert Windows with a link to this page, and cite the original source named beside each figure.
Method and Sources
The figures on this page were compiled in November 2026 from CSO open data tables pulled through the PxStat API with every dimension set explicitly: Census tables F2019 (households by type, tenure and period built, 2011 to 2022), F2024 (weekly rent by type, 2016 and 2022) and F2027 (vacancy rate by type); New Dwelling Completions table NDQ06 (by type and local authority, to Q3 2026) and the Q3 2026 release; and Domestic Building Energy Ratings table EBQ02 (cumulative to Q3 2026). Rents in new tenancies come from the RTB Rent Index for Q1 2026, published by the ESRI. Window figures come from Expert Windows’ own analysis of the full SEAI BER Research Tool dataset as published on 3 November 2026. Annual and twelve-month totals, shares and changes were calculated by Expert Windows and are labelled as such. Every figure was checked against its source before publication.
How Expert Windows Helps
Expert Windows replaces windows and balcony doors in apartments across Dublin, working with owners, landlords and management companies. Our apartment window and door replacement service covers made-to-measure windows, balcony doors and entrance doors, and our window replacement team can survey your apartment and provide a quotation.