Skip to content

Last updated: October 2026. Human written and fact checked against each named source.
Irish households pay the highest electricity prices in the European Union, and a record number of them are now behind on their bills. This page gathers the current statistics on household energy use and bills in Ireland in one place: how much electricity and gas a typical home uses, what that costs, how bills compare with the rest of the EU, where the energy actually goes, and how many households are in arrears, with every figure linked to its primary source.
Key Household Energy Use and Bill Statistics for Ireland at a Glance
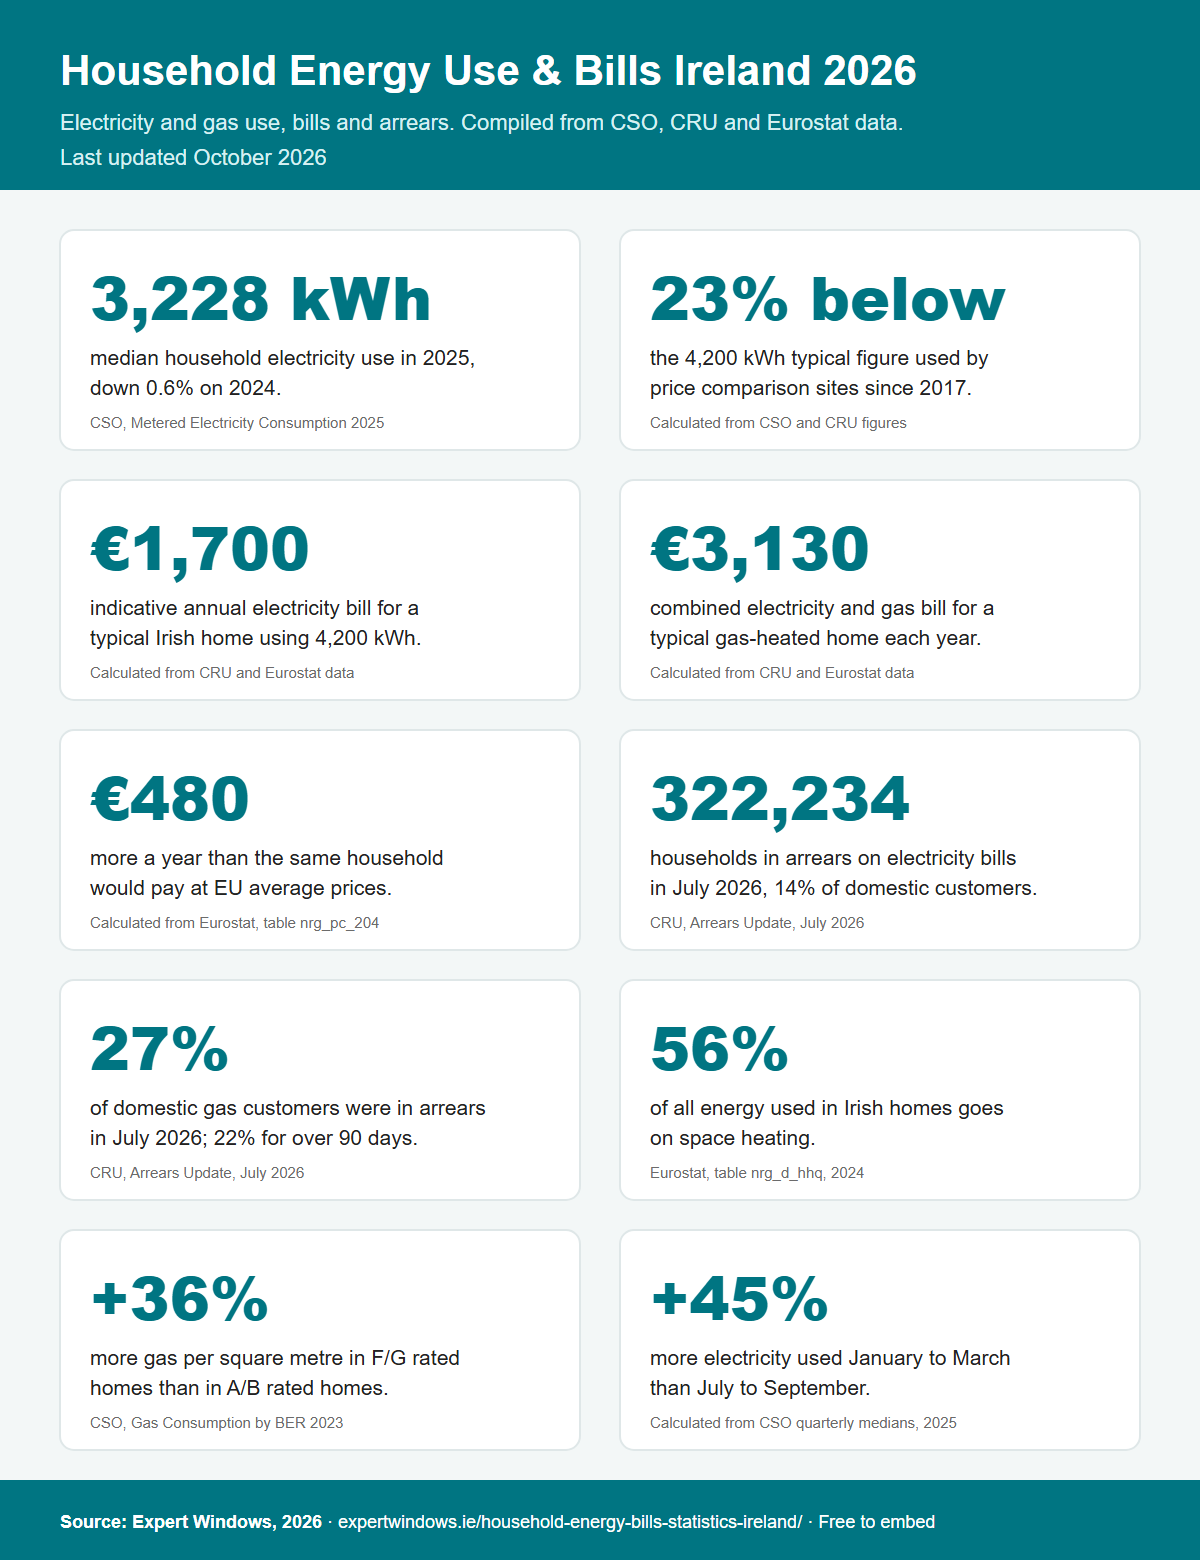
- The median Irish household used 3,228 kWh of electricity in 2025, down 0.6% on 2024. Source: CSO, Metered Electricity Consumption 2025
- That measured median is about 23% below the 4,200 kWh “typical” figure the energy regulator set in 2017, which price comparison sites still use. Calculated from CSO and CRU figures
- At the typical 4,200 kWh and Ireland’s average household price, an indicative annual electricity bill is about €1,700. Calculated from CRU and Eurostat data
- A typical gas-heated home using 11,000 kWh of gas pays about €1,430 a year for it, taking the combined indicative energy bill to about €3,130. Calculated from CRU and Eurostat data
- At the EU average electricity price, the same typical household would pay about €480 a year less. Calculated from Eurostat, table nrg_pc_204
- 322,234 households were in arrears on their electricity bills in July 2026, 14% of domestic customers, up from 200,819 at the start of 2023. Source: CRU, Arrears and NPA Disconnections, July 2026 Update
- 27% of domestic gas customers were in arrears in July 2026, and 22% had been in arrears for more than 90 days. Source: CRU, July 2026
- 8.8% of people in Ireland were in arrears on utility bills in 2025, against an EU average of 7.0%. Source: Eurostat, table ilc_mdes07
- Space heating accounts for 56.0% of all energy used in Irish homes. Source: Eurostat, table nrg_d_hhq, 2024
- Gas-heated homes rated F or G use 36% more gas per square metre than homes rated A or B. Source: CSO, Household Gas Consumption by Building Energy Ratings 2023
How Much Electricity Irish Homes Use
The most accurate measure of household electricity use in Ireland comes from smart and standard meter readings, which the CSO publishes each year. Its Metered Electricity Consumption 2025 release, published on 7 July 2026, puts the national median for a residential customer at 3,228 kWh for the year, a fall of 0.6% on 2024. Around 10% of residential customers used less than 1,000 kWh over the whole year.
Homes account for a smaller share of the country’s electricity than most people assume. Of the 32,986 GWh of metered electricity consumed in 2025, residential customers used 28% and commercial and industrial customers 72%. The number of residential meters rose by 11% between 2016 and 2025, with 231,855 residential connections added over that period.
Use varies noticeably by county. The CSO reports these medians for 2025:
| County | Median household electricity use, 2025 |
|---|---|
| Kildare (highest) | 3,846 kWh |
| National median | 3,228 kWh |
| Mayo | 2,831 kWh |
| Leitrim | 2,677 kWh |
| Donegal (lowest) | 2,630 kWh |
Figures from CSO Metered Electricity Consumption 2025. By share of total residential consumption, the Dublin postal districts led at 19%, followed by Cork at 12%.
Why “Average” Bills Online Often Look High
Most bill comparisons in Ireland still use the typical consumption figures set by the Commission for Regulation of Utilities in a March 2017 decision: 4,200 kWh a year for electricity and 11,000 kWh for gas. The CRU requires accredited price comparison sites and suppliers to use those figures, which is why they appear on almost every tariff comparison.
Measured use has since moved away from that benchmark. The CSO’s 2025 median of 3,228 kWh is about 23% below the CRU’s 4,200 kWh, a gap calculated from the two published figures. The two numbers are not strictly the same measure, since a median is not an average and the CSO figure includes homes with very low use, but the difference means that a bill quoted at “typical consumption” will overstate what many households actually pay.
Winter and Summer: The Seasonal Swing
Household electricity use in Ireland peaks sharply in winter. According to the CSO, January to March 2025 accounted for 31% of annual residential consumption, with a quarterly median of 907 kWh. July to September was the low point, at 21% of the annual total and a median of 625 kWh. Calculated from those medians, a typical home uses about 45% more electricity in the first quarter than in the third.
The winter peak reflects lighting, time spent indoors and, increasingly, electric heating. It is also the period when heat loss through a home’s walls, roof, windows and doors costs the most to replace.
Gas Use and the Typical Gas-Heated Home
Mains gas is the main space heating fuel in 34% of Ireland’s BER-rated homes, the same share as heating oil, with electricity at 25%, according to the CSO’s Domestic Building Energy Ratings release for Q1 2026. For gas homes, the CRU’s typical figure is 11,000 kWh a year.
Actual gas use depends heavily on the type of home. The CSO’s analysis of household gas consumption by Building Energy Rating, which matched Gas Networks Ireland meter data to SEAI BER records, found that detached houses used a mean of 12,411 kWh of gas in 2023, 87% more than the 6,653 kWh used by apartments. Gas use fell by between 10% and 12% in 2023 compared with 2022 across every dwelling type and rating, as households cut back after the 2022 price spike.
What a Typical Household Pays
Combining the consumption figures above with Eurostat’s household price data gives indicative annual bills. The prices are Ireland’s averages for the second half of 2025, including all taxes and levies, for the standard household consumption bands: 2,500 to 4,999 kWh for electricity and 20 to 199 GJ for gas.
| Scenario | Annual use | Price per kWh | Indicative annual cost |
|---|---|---|---|
| Electricity, CSO median household | 3,228 kWh | 40.42 cent | €1,305 |
| Electricity, CRU typical household | 4,200 kWh | 40.42 cent | €1,698 |
| Gas, CRU typical household | 11,000 kWh | 13.00 cent | €1,430 |
| Typical gas-heated home, electricity and gas combined | 4,200 kWh + 11,000 kWh | €3,128 |
Costs calculated by Expert Windows from CSO and CRU consumption figures and Eurostat household prices. Real bills vary with supplier, tariff, standing charges, discounts and the time of year a household uses its energy. Current unit prices for every heating fuel, including oil, are on our home heating costs statistics page.
How Irish Bills Compare With the EU
Electricity is where Ireland stands out. At 40.42 cent per kWh in the second half of 2025, Irish household electricity was the most expensive of the 38 countries reporting to Eurostat, against an EU average of 28.96 cent. At the EU average price, the CRU’s typical 4,200 kWh would cost about €1,216 a year, roughly €480 less than it costs in Ireland. Both figures are calculated from Eurostat table nrg_pc_204.
Gas is much closer to the European norm. Irish household gas cost 13.00 cent per kWh over the same period, the sixth highest of 30 reporting countries and slightly above the EU average of 12.28 cent, according to Eurostat table nrg_pc_202. At the EU average price, a typical 11,000 kWh gas bill would be about €79 lower. In other words, almost all of the gap between Irish and European household energy bills comes from electricity.
Where the Energy Goes
Eurostat breaks household energy use down by purpose. Its 2024 figures show how Irish homes compare with the EU as a whole:
| End use | Ireland, share of household energy | EU average |
|---|---|---|
| Space heating | 56.0% | 61.5% |
| Water heating | 21.5% | 15.6% |
| Lighting and electrical appliances | 19.1% | 14.8% |
| Cooking | 2.4% | 6.4% |
| Other uses | 1.0% | 0.9% |
Shares calculated by Expert Windows from Eurostat’s 2024 household energy balance in terajoules. Heating space and water together accounts for more than three quarters of the energy used in Irish homes, which is why the fabric of a building, how well it holds heat, has more influence on an energy bill than any appliance choice.
Energy Arrears at a Record High
The number of households struggling to pay has climbed steadily since 2023. The Commission for Regulation of Utilities publishes monthly arrears data from suppliers, and its July 2026 update, published on 10 September 2026, shows the trend for domestic electricity customers:
| Period | Domestic electricity customers in arrears | Share of domestic customers |
|---|---|---|
| Q1 2023 | 200,819 | 9% |
| Q1 2024 | 230,451 | 10% |
| Q1 2025 | 286,553 | 13% |
| Q1 2026 | 318,735 | 14% |
| May 2026 (peak) | 328,273 | 14% |
| July 2026 | 322,234 | 14% |
Between the first quarter of 2023 and the second quarter of 2026, the number of domestic electricity customers in arrears rose by about 61%, a figure calculated from the CRU’s quarterly totals. Gas arrears are proportionally higher still: 188,882 domestic gas customers, 27% of the total, were in arrears in July 2026, and 22% of gas customers had owed money for more than 90 days, against 8% of electricity customers. The average domestic account in arrears owed €509.22 for electricity and €206.88 for gas.
The CRU counts every customer in arrears regardless of the amount, so the totals include people who have simply missed one payment. The longer-term figures are the clearer signal of hardship. Eurostat’s comparable household survey measure points the same way: 8.8% of people in Ireland were in arrears on utility bills in 2025, against an EU average of 7.0%, according to Eurostat table ilc_mdes07. Households that are behind can ask their supplier for a payment plan, and the CRU sets out the protections suppliers must offer on its consumer billing page.
How a Home’s Energy Rating Changes the Bill
For gas-heated homes, the CSO’s matched meter and BER data shows a clear link between energy rating and consumption per square metre in 2023:
| BER rating | Mean gas use per square metre, 2023 |
|---|---|
| A or B | 69 kWh |
| C | 78 kWh |
| D | 86 kWh |
| E | 91 kWh |
| F or G | 94 kWh |
Figures from the CSO’s Household Gas Consumption by Building Energy Ratings 2023. Homes rated F or G used 36% more gas per square metre than those rated A or B.
The same release carries an honest caveat. Because better-rated homes tend to be larger, A and B rated dwellings actually used 8% more gas in total than F and G rated dwellings (9,032 kWh against 8,387 kWh). Detached houses rated A or B averaged 191 square metres, against 124 for detached houses rated F or G. Efficiency lowers the cost of heating each square metre, not necessarily the total bill of a bigger house.
Applied to a like-for-like home, the per-square-metre gap is significant. At the 118 square metre average floor area of Ireland’s BER-rated dwellings, the difference between F or G and A or B works out at about 2,950 kWh of gas a year, roughly €384 at the second-half 2025 price. That is an illustrative figure, calculated from the CSO’s per-square-metre means, the CSO’s average floor area and Eurostat’s gas price. Age matters too: homes built between 2005 and 2023 used 73 kWh per square metre, 14% less than the 85 kWh used by homes built between 1900 and 1966.
Windows and doors are one part of that picture. SEAI’s guidance on home energy upgrades puts heat loss through poorly performing windows and doors at about 10% of a home’s total, with up to 30% escaping through poorly insulated roofs and walls. The national picture of ratings by county and age is on our home energy efficiency statistics page, and our Irish housing stock statistics show that 65% of occupied homes were built before 2001.
Method and Sources
The figures on this page were compiled in September and October 2026 from the Central Statistics Office (Metered Electricity Consumption 2025, published 7 July 2026; Household Gas Consumption by Building Energy Ratings 2023, published 3 September 2024; and Domestic Building Energy Ratings Q1 2026), the Commission for Regulation of Utilities (the typical consumption decision of 21 March 2017 and the Arrears and NPA Disconnections July 2026 Update, published 10 September 2026), Eurostat (household electricity prices, table nrg_pc_204, and gas prices, table nrg_pc_202, for the second half of 2025; household energy use by purpose, table nrg_d_hhq, for 2024; and arrears on utility bills, table ilc_mdes07, for 2025, all extracted via the Eurostat API), and SEAI’s home energy upgrade guidance. Indicative bills, the EU bill comparisons, the gap between measured and typical consumption, the seasonal swing, the growth in arrears, the end-use shares and the illustrative saving by energy rating were calculated by Expert Windows from the cited tables and are labelled as such. Every figure was checked against its source before publication, and the page will be updated when the CRU publishes its next arrears update, when Eurostat releases first-half 2026 prices, and after any energy measures in Budget 2027.
How Expert Windows Helps
Heating accounts for more than half of the energy used in Irish homes, and Irish households pay the highest electricity prices in Europe, so heat that escapes through old glazing is expensive heat. Expert Windows supplies and fits double glazed and triple glazed windows and energy-efficient external doors across Dublin and the surrounding counties. If you are planning a window replacement before the worst of the winter, contact us for a survey and a quotation.